Macedonian vs Yaqui Householder Income Ages 25 - 44 years
COMPARE
Macedonian
Yaqui
Householder Income Ages 25 - 44 years
Householder Income Ages 25 - 44 years Comparison
Macedonians
Yaqui
$101,882
HOUSEHOLDER INCOME AGES 25 - 44 YEARS
98.3/ 100
METRIC RATING
96th/ 347
METRIC RANK
$81,656
HOUSEHOLDER INCOME AGES 25 - 44 YEARS
0.1/ 100
METRIC RATING
292nd/ 347
METRIC RANK
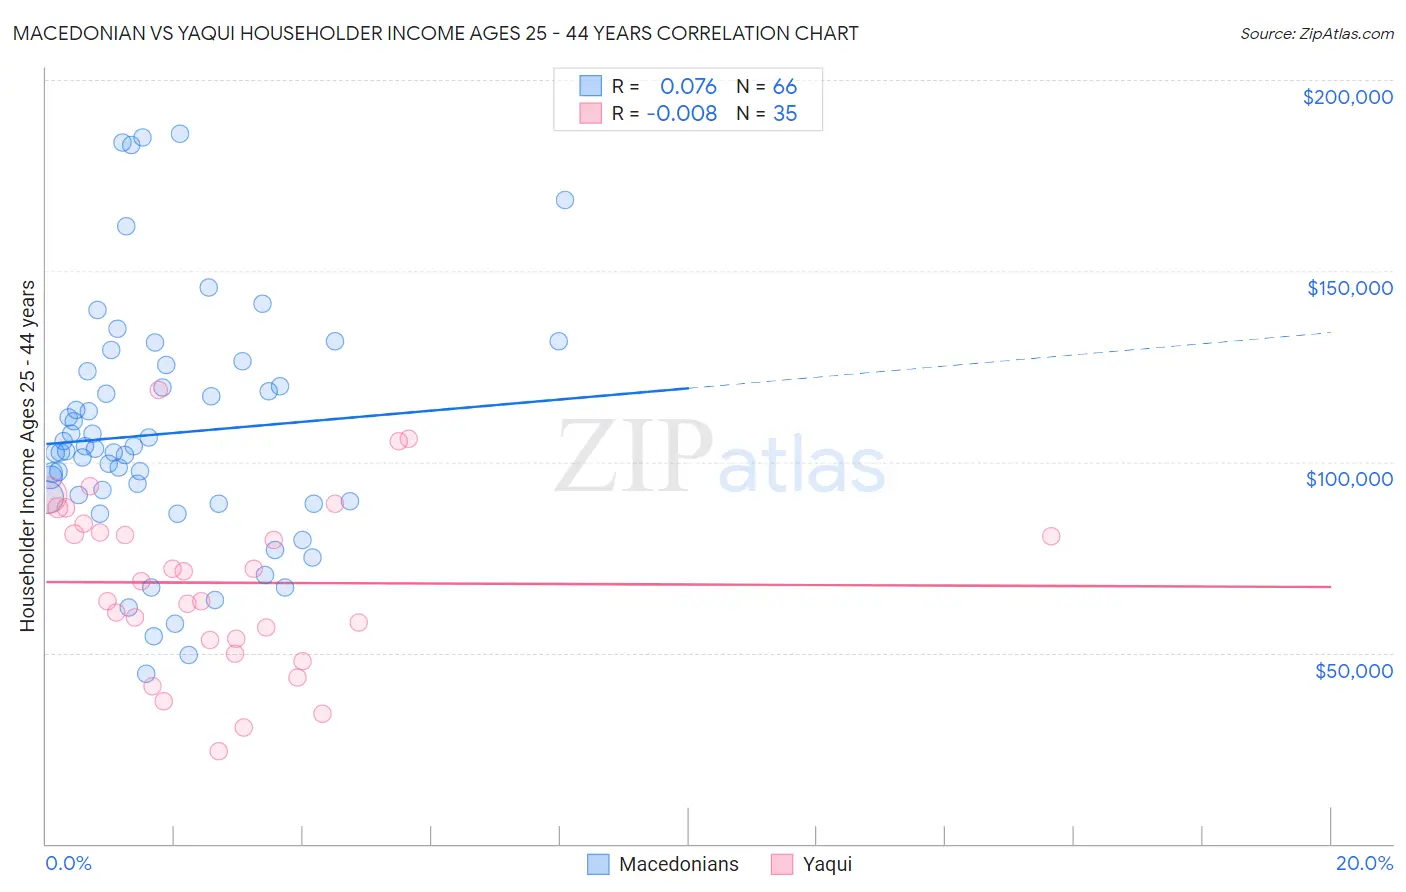
Macedonian vs Yaqui Householder Income Ages 25 - 44 years Correlation Chart
The statistical analysis conducted on geographies consisting of 132,531,102 people shows a slight positive correlation between the proportion of Macedonians and household income with householder between the ages 25 and 44 in the United States with a correlation coefficient (R) of 0.076 and weighted average of $101,882. Similarly, the statistical analysis conducted on geographies consisting of 107,629,543 people shows no correlation between the proportion of Yaqui and household income with householder between the ages 25 and 44 in the United States with a correlation coefficient (R) of -0.008 and weighted average of $81,656, a difference of 24.8%.
Householder Income Ages 25 - 44 years Correlation Summary
| Measurement | Macedonian | Yaqui |
| Minimum | $44,379 | $24,313 |
| Maximum | $185,978 | $118,928 |
| Range | $141,599 | $94,615 |
| Mean | $107,344 | $68,343 |
| Median | $103,107 | $68,776 |
| Interquartile 25% (IQ1) | $89,835 | $53,438 |
| Interquartile 75% (IQ3) | $123,584 | $83,858 |
| Interquartile Range (IQR) | $33,749 | $30,420 |
| Standard Deviation (Sample) | $31,913 | $22,560 |
| Standard Deviation (Population) | $31,670 | $22,236 |
Similar Demographics by Householder Income Ages 25 - 44 years
Demographics Similar to Macedonians by Householder Income Ages 25 - 44 years
In terms of householder income ages 25 - 44 years, the demographic groups most similar to Macedonians are Austrian ($101,842, a difference of 0.040%), Assyrian/Chaldean/Syriac ($101,936, a difference of 0.050%), Sri Lankan ($101,960, a difference of 0.080%), Immigrants from England ($102,020, a difference of 0.14%), and Immigrants from Kazakhstan ($101,727, a difference of 0.15%).
| Demographics | Rating | Rank | Householder Income Ages 25 - 44 years |
| Romanians | 98.8 /100 | #89 | Exceptional $102,544 |
| Ukrainians | 98.8 /100 | #90 | Exceptional $102,451 |
| Croatians | 98.7 /100 | #91 | Exceptional $102,414 |
| Immigrants | North America | 98.7 /100 | #92 | Exceptional $102,407 |
| Immigrants | England | 98.4 /100 | #93 | Exceptional $102,020 |
| Sri Lankans | 98.4 /100 | #94 | Exceptional $101,960 |
| Assyrians/Chaldeans/Syriacs | 98.3 /100 | #95 | Exceptional $101,936 |
| Macedonians | 98.3 /100 | #96 | Exceptional $101,882 |
| Austrians | 98.3 /100 | #97 | Exceptional $101,842 |
| Immigrants | Kazakhstan | 98.1 /100 | #98 | Exceptional $101,727 |
| Taiwanese | 97.9 /100 | #99 | Exceptional $101,492 |
| Immigrants | Argentina | 97.8 /100 | #100 | Exceptional $101,415 |
| Albanians | 97.8 /100 | #101 | Exceptional $101,367 |
| Immigrants | Lebanon | 97.4 /100 | #102 | Exceptional $101,124 |
| Immigrants | Moldova | 97.4 /100 | #103 | Exceptional $101,091 |
Demographics Similar to Yaqui by Householder Income Ages 25 - 44 years
In terms of householder income ages 25 - 44 years, the demographic groups most similar to Yaqui are Potawatomi ($81,774, a difference of 0.14%), Blackfeet ($81,531, a difference of 0.15%), Cuban ($81,483, a difference of 0.21%), Bangladeshi ($81,363, a difference of 0.36%), and Immigrants from Dominica ($81,351, a difference of 0.37%).
| Demographics | Rating | Rank | Householder Income Ages 25 - 44 years |
| Immigrants | Somalia | 0.1 /100 | #285 | Tragic $82,188 |
| Ute | 0.1 /100 | #286 | Tragic $82,166 |
| Immigrants | Latin America | 0.1 /100 | #287 | Tragic $82,166 |
| Comanche | 0.1 /100 | #288 | Tragic $82,152 |
| Shoshone | 0.1 /100 | #289 | Tragic $82,062 |
| Liberians | 0.1 /100 | #290 | Tragic $82,005 |
| Potawatomi | 0.1 /100 | #291 | Tragic $81,774 |
| Yaqui | 0.1 /100 | #292 | Tragic $81,656 |
| Blackfeet | 0.1 /100 | #293 | Tragic $81,531 |
| Cubans | 0.1 /100 | #294 | Tragic $81,483 |
| Bangladeshis | 0.1 /100 | #295 | Tragic $81,363 |
| Immigrants | Dominica | 0.1 /100 | #296 | Tragic $81,351 |
| Immigrants | Guatemala | 0.1 /100 | #297 | Tragic $81,341 |
| Dominicans | 0.1 /100 | #298 | Tragic $81,229 |
| Immigrants | Liberia | 0.1 /100 | #299 | Tragic $80,863 |