American vs Slovak Median Household Income
COMPARE
American
Slovak
Median Household Income
Median Household Income Comparison
Americans
Slovaks
$75,932
MEDIAN HOUSEHOLD INCOME
0.3/ 100
METRIC RATING
266th/ 347
METRIC RANK
$83,798
MEDIAN HOUSEHOLD INCOME
30.2/ 100
METRIC RATING
190th/ 347
METRIC RANK
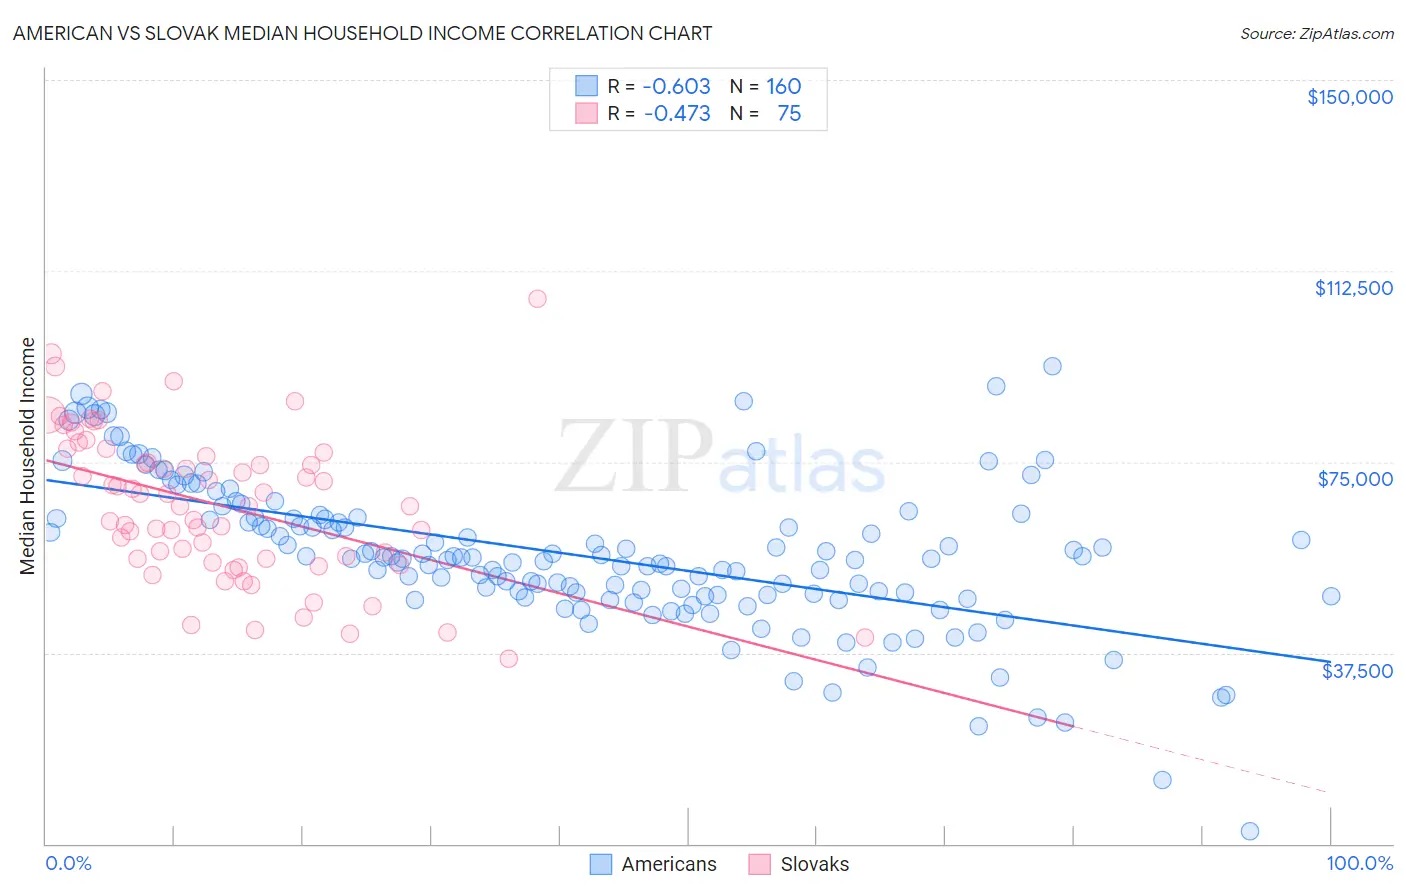
American vs Slovak Median Household Income Correlation Chart
The statistical analysis conducted on geographies consisting of 580,584,472 people shows a significant negative correlation between the proportion of Americans and median household income in the United States with a correlation coefficient (R) of -0.603 and weighted average of $75,932. Similarly, the statistical analysis conducted on geographies consisting of 397,588,666 people shows a moderate negative correlation between the proportion of Slovaks and median household income in the United States with a correlation coefficient (R) of -0.473 and weighted average of $83,798, a difference of 10.4%.
Median Household Income Correlation Summary
| Measurement | American | Slovak |
| Minimum | $2,499 | $36,453 |
| Maximum | $93,750 | $106,990 |
| Range | $91,251 | $70,537 |
| Mean | $56,747 | $66,640 |
| Median | $56,097 | $66,359 |
| Interquartile 25% (IQ1) | $48,888 | $55,938 |
| Interquartile 75% (IQ3) | $64,069 | $76,771 |
| Interquartile Range (IQR) | $15,181 | $20,833 |
| Standard Deviation (Sample) | $14,812 | $14,677 |
| Standard Deviation (Population) | $14,765 | $14,579 |
Similar Demographics by Median Household Income
Demographics Similar to Americans by Median Household Income
In terms of median household income, the demographic groups most similar to Americans are Immigrants from Belize ($75,938, a difference of 0.010%), Guatemalan ($75,961, a difference of 0.040%), German Russian ($75,856, a difference of 0.10%), Immigrants from Jamaica ($75,851, a difference of 0.11%), and Cape Verdean ($75,848, a difference of 0.11%).
| Demographics | Rating | Rank | Median Household Income |
| Spanish American Indians | 0.4 /100 | #259 | Tragic $76,670 |
| Jamaicans | 0.4 /100 | #260 | Tragic $76,583 |
| Immigrants | Grenada | 0.4 /100 | #261 | Tragic $76,517 |
| French American Indians | 0.4 /100 | #262 | Tragic $76,387 |
| Alaskan Athabascans | 0.4 /100 | #263 | Tragic $76,383 |
| Guatemalans | 0.3 /100 | #264 | Tragic $75,961 |
| Immigrants | Belize | 0.3 /100 | #265 | Tragic $75,938 |
| Americans | 0.3 /100 | #266 | Tragic $75,932 |
| German Russians | 0.3 /100 | #267 | Tragic $75,856 |
| Immigrants | Jamaica | 0.3 /100 | #268 | Tragic $75,851 |
| Cape Verdeans | 0.3 /100 | #269 | Tragic $75,848 |
| Hmong | 0.3 /100 | #270 | Tragic $75,839 |
| Pennsylvania Germans | 0.3 /100 | #271 | Tragic $75,814 |
| Somalis | 0.3 /100 | #272 | Tragic $75,782 |
| Liberians | 0.2 /100 | #273 | Tragic $75,667 |
Demographics Similar to Slovaks by Median Household Income
In terms of median household income, the demographic groups most similar to Slovaks are Iraqi ($83,753, a difference of 0.050%), Immigrants from Colombia ($83,902, a difference of 0.12%), Tlingit-Haida ($83,968, a difference of 0.20%), Welsh ($83,628, a difference of 0.20%), and Finnish ($83,607, a difference of 0.23%).
| Demographics | Rating | Rank | Median Household Income |
| Spaniards | 42.7 /100 | #183 | Average $84,644 |
| Immigrants | Eastern Africa | 37.4 /100 | #184 | Fair $84,299 |
| Kenyans | 34.2 /100 | #185 | Fair $84,085 |
| Puget Sound Salish | 33.2 /100 | #186 | Fair $84,011 |
| Belgians | 33.2 /100 | #187 | Fair $84,008 |
| Tlingit-Haida | 32.6 /100 | #188 | Fair $83,968 |
| Immigrants | Colombia | 31.7 /100 | #189 | Fair $83,902 |
| Slovaks | 30.2 /100 | #190 | Fair $83,798 |
| Iraqis | 29.6 /100 | #191 | Fair $83,753 |
| Welsh | 28.0 /100 | #192 | Fair $83,628 |
| Finns | 27.7 /100 | #193 | Fair $83,607 |
| Ghanaians | 27.4 /100 | #194 | Fair $83,582 |
| Immigrants | Armenia | 27.0 /100 | #195 | Fair $83,555 |
| French | 26.0 /100 | #196 | Fair $83,468 |
| Aleuts | 25.7 /100 | #197 | Fair $83,446 |