Tohono O'odham vs Slovak Median Household Income
COMPARE
Tohono O'odham
Slovak
Median Household Income
Median Household Income Comparison
Tohono O'odham
Slovaks
$61,663
MEDIAN HOUSEHOLD INCOME
0.0/ 100
METRIC RATING
344th/ 347
METRIC RANK
$83,798
MEDIAN HOUSEHOLD INCOME
30.2/ 100
METRIC RATING
190th/ 347
METRIC RANK
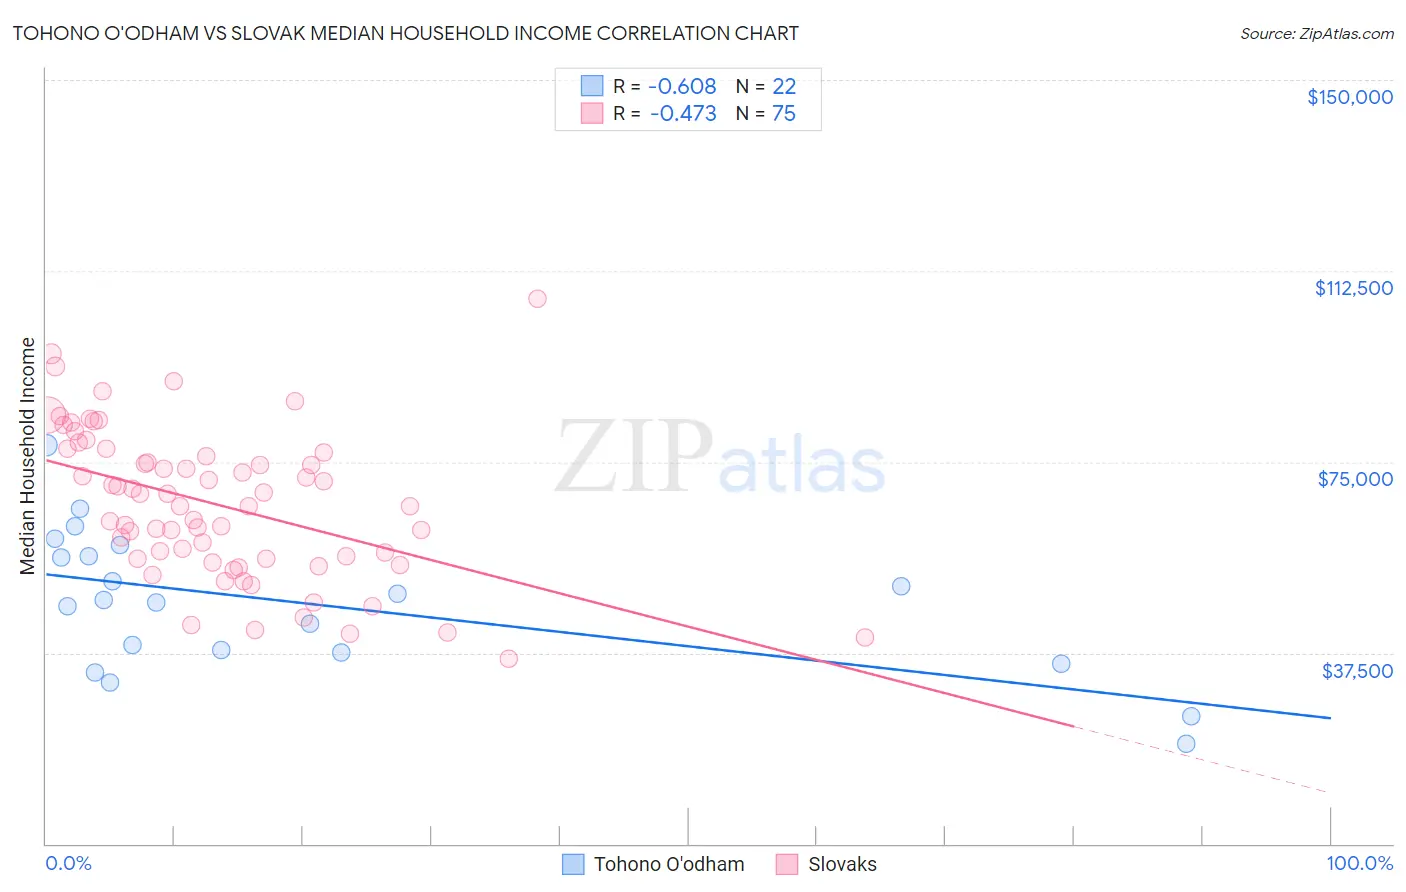
Tohono O'odham vs Slovak Median Household Income Correlation Chart
The statistical analysis conducted on geographies consisting of 58,714,823 people shows a significant negative correlation between the proportion of Tohono O'odham and median household income in the United States with a correlation coefficient (R) of -0.608 and weighted average of $61,663. Similarly, the statistical analysis conducted on geographies consisting of 397,588,666 people shows a moderate negative correlation between the proportion of Slovaks and median household income in the United States with a correlation coefficient (R) of -0.473 and weighted average of $83,798, a difference of 35.9%.
Median Household Income Correlation Summary
| Measurement | Tohono O'odham | Slovak |
| Minimum | $19,643 | $36,453 |
| Maximum | $78,331 | $106,990 |
| Range | $58,688 | $70,537 |
| Mean | $47,012 | $66,640 |
| Median | $47,638 | $66,359 |
| Interquartile 25% (IQ1) | $37,566 | $55,938 |
| Interquartile 75% (IQ3) | $56,538 | $76,771 |
| Interquartile Range (IQR) | $18,972 | $20,833 |
| Standard Deviation (Sample) | $13,995 | $14,677 |
| Standard Deviation (Population) | $13,673 | $14,579 |
Similar Demographics by Median Household Income
Demographics Similar to Tohono O'odham by Median Household Income
In terms of median household income, the demographic groups most similar to Tohono O'odham are Houma ($62,575, a difference of 1.5%), Pima ($63,262, a difference of 2.6%), Crow ($63,681, a difference of 3.3%), Puerto Rican ($59,197, a difference of 4.2%), and Navajo ($59,159, a difference of 4.2%).
| Demographics | Rating | Rank | Median Household Income |
| Creek | 0.0 /100 | #333 | Tragic $67,715 |
| Blacks/African Americans | 0.0 /100 | #334 | Tragic $67,573 |
| Cheyenne | 0.0 /100 | #335 | Tragic $66,974 |
| Immigrants | Congo | 0.0 /100 | #336 | Tragic $66,768 |
| Kiowa | 0.0 /100 | #337 | Tragic $65,914 |
| Immigrants | Yemen | 0.0 /100 | #338 | Tragic $65,194 |
| Hopi | 0.0 /100 | #339 | Tragic $65,043 |
| Pueblo | 0.0 /100 | #340 | Tragic $64,692 |
| Crow | 0.0 /100 | #341 | Tragic $63,681 |
| Pima | 0.0 /100 | #342 | Tragic $63,262 |
| Houma | 0.0 /100 | #343 | Tragic $62,575 |
| Tohono O'odham | 0.0 /100 | #344 | Tragic $61,663 |
| Puerto Ricans | 0.0 /100 | #345 | Tragic $59,197 |
| Navajo | 0.0 /100 | #346 | Tragic $59,159 |
| Lumbee | 0.0 /100 | #347 | Tragic $54,644 |
Demographics Similar to Slovaks by Median Household Income
In terms of median household income, the demographic groups most similar to Slovaks are Iraqi ($83,753, a difference of 0.050%), Immigrants from Colombia ($83,902, a difference of 0.12%), Tlingit-Haida ($83,968, a difference of 0.20%), Welsh ($83,628, a difference of 0.20%), and Finnish ($83,607, a difference of 0.23%).
| Demographics | Rating | Rank | Median Household Income |
| Spaniards | 42.7 /100 | #183 | Average $84,644 |
| Immigrants | Eastern Africa | 37.4 /100 | #184 | Fair $84,299 |
| Kenyans | 34.2 /100 | #185 | Fair $84,085 |
| Puget Sound Salish | 33.2 /100 | #186 | Fair $84,011 |
| Belgians | 33.2 /100 | #187 | Fair $84,008 |
| Tlingit-Haida | 32.6 /100 | #188 | Fair $83,968 |
| Immigrants | Colombia | 31.7 /100 | #189 | Fair $83,902 |
| Slovaks | 30.2 /100 | #190 | Fair $83,798 |
| Iraqis | 29.6 /100 | #191 | Fair $83,753 |
| Welsh | 28.0 /100 | #192 | Fair $83,628 |
| Finns | 27.7 /100 | #193 | Fair $83,607 |
| Ghanaians | 27.4 /100 | #194 | Fair $83,582 |
| Immigrants | Armenia | 27.0 /100 | #195 | Fair $83,555 |
| French | 26.0 /100 | #196 | Fair $83,468 |
| Aleuts | 25.7 /100 | #197 | Fair $83,446 |