Immigrants from Ukraine vs Slovak Median Household Income
COMPARE
Immigrants from Ukraine
Slovak
Median Household Income
Median Household Income Comparison
Immigrants from Ukraine
Slovaks
$91,124
MEDIAN HOUSEHOLD INCOME
98.0/ 100
METRIC RATING
103rd/ 347
METRIC RANK
$83,798
MEDIAN HOUSEHOLD INCOME
30.2/ 100
METRIC RATING
190th/ 347
METRIC RANK
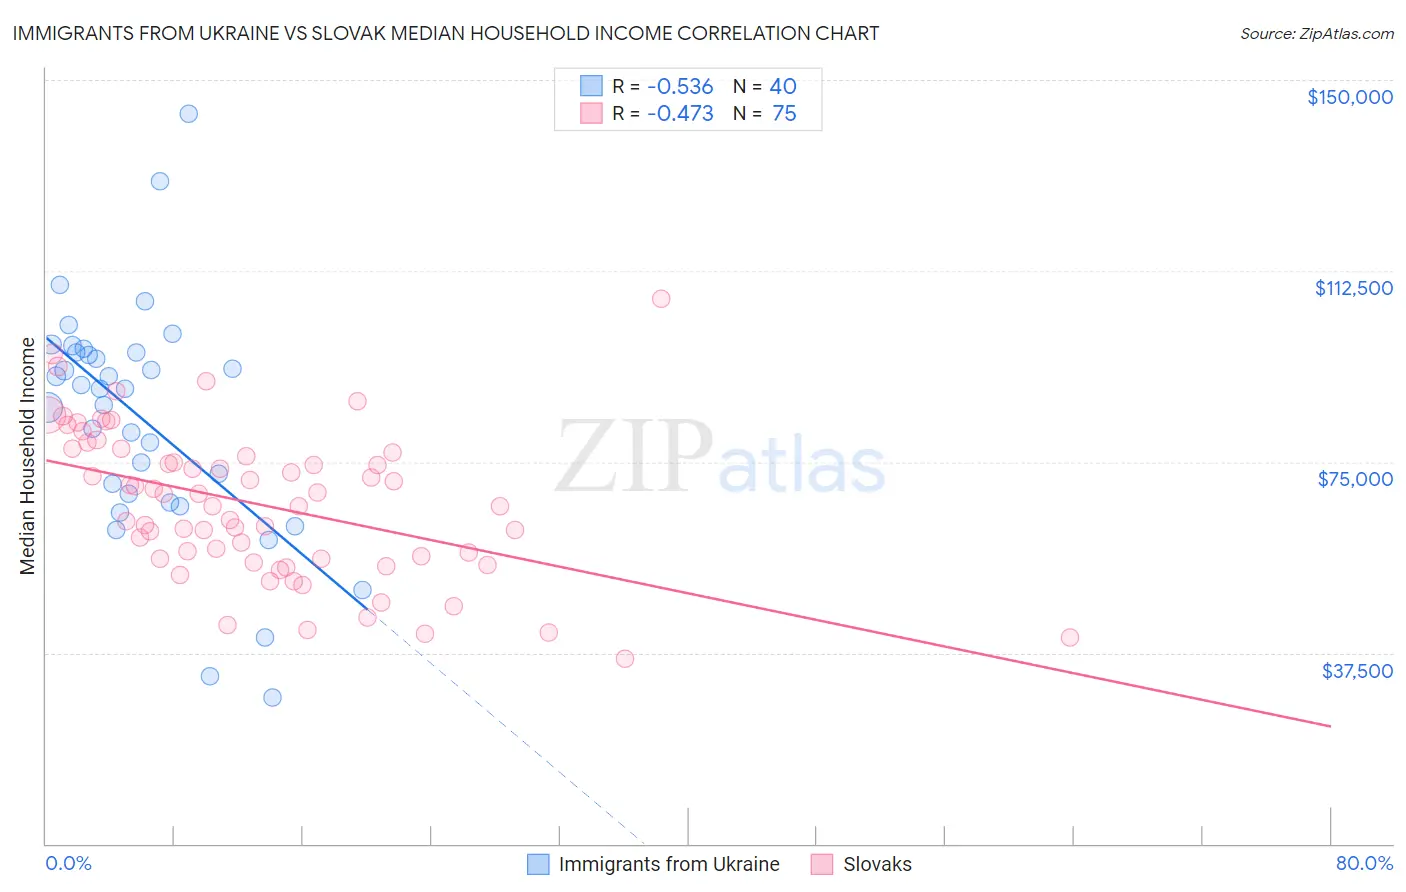
Immigrants from Ukraine vs Slovak Median Household Income Correlation Chart
The statistical analysis conducted on geographies consisting of 289,588,656 people shows a substantial negative correlation between the proportion of Immigrants from Ukraine and median household income in the United States with a correlation coefficient (R) of -0.536 and weighted average of $91,124. Similarly, the statistical analysis conducted on geographies consisting of 397,588,666 people shows a moderate negative correlation between the proportion of Slovaks and median household income in the United States with a correlation coefficient (R) of -0.473 and weighted average of $83,798, a difference of 8.7%.
Median Household Income Correlation Summary
| Measurement | Immigrants from Ukraine | Slovak |
| Minimum | $28,750 | $36,453 |
| Maximum | $143,440 | $106,990 |
| Range | $114,690 | $70,537 |
| Mean | $83,370 | $66,640 |
| Median | $89,400 | $66,359 |
| Interquartile 25% (IQ1) | $67,859 | $55,938 |
| Interquartile 75% (IQ3) | $96,595 | $76,771 |
| Interquartile Range (IQR) | $28,737 | $20,833 |
| Standard Deviation (Sample) | $23,179 | $14,677 |
| Standard Deviation (Population) | $22,887 | $14,579 |
Similar Demographics by Median Household Income
Demographics Similar to Immigrants from Ukraine by Median Household Income
In terms of median household income, the demographic groups most similar to Immigrants from Ukraine are Immigrants from Kazakhstan ($91,015, a difference of 0.12%), Austrian ($91,339, a difference of 0.24%), Immigrants from Brazil ($90,907, a difference of 0.24%), Immigrants from Moldova ($91,446, a difference of 0.35%), and Ukrainian ($91,456, a difference of 0.36%).
| Demographics | Rating | Rank | Median Household Income |
| Jordanians | 98.7 /100 | #96 | Exceptional $91,794 |
| Immigrants | Serbia | 98.6 /100 | #97 | Exceptional $91,730 |
| Immigrants | Southern Europe | 98.5 /100 | #98 | Exceptional $91,605 |
| Immigrants | South Eastern Asia | 98.4 /100 | #99 | Exceptional $91,541 |
| Ukrainians | 98.3 /100 | #100 | Exceptional $91,456 |
| Immigrants | Moldova | 98.3 /100 | #101 | Exceptional $91,446 |
| Austrians | 98.2 /100 | #102 | Exceptional $91,339 |
| Immigrants | Ukraine | 98.0 /100 | #103 | Exceptional $91,124 |
| Immigrants | Kazakhstan | 97.8 /100 | #104 | Exceptional $91,015 |
| Immigrants | Brazil | 97.7 /100 | #105 | Exceptional $90,907 |
| Macedonians | 97.4 /100 | #106 | Exceptional $90,761 |
| Croatians | 97.3 /100 | #107 | Exceptional $90,685 |
| Zimbabweans | 97.2 /100 | #108 | Exceptional $90,618 |
| Chileans | 97.2 /100 | #109 | Exceptional $90,605 |
| Palestinians | 97.1 /100 | #110 | Exceptional $90,574 |
Demographics Similar to Slovaks by Median Household Income
In terms of median household income, the demographic groups most similar to Slovaks are Iraqi ($83,753, a difference of 0.050%), Immigrants from Colombia ($83,902, a difference of 0.12%), Tlingit-Haida ($83,968, a difference of 0.20%), Welsh ($83,628, a difference of 0.20%), and Finnish ($83,607, a difference of 0.23%).
| Demographics | Rating | Rank | Median Household Income |
| Spaniards | 42.7 /100 | #183 | Average $84,644 |
| Immigrants | Eastern Africa | 37.4 /100 | #184 | Fair $84,299 |
| Kenyans | 34.2 /100 | #185 | Fair $84,085 |
| Puget Sound Salish | 33.2 /100 | #186 | Fair $84,011 |
| Belgians | 33.2 /100 | #187 | Fair $84,008 |
| Tlingit-Haida | 32.6 /100 | #188 | Fair $83,968 |
| Immigrants | Colombia | 31.7 /100 | #189 | Fair $83,902 |
| Slovaks | 30.2 /100 | #190 | Fair $83,798 |
| Iraqis | 29.6 /100 | #191 | Fair $83,753 |
| Welsh | 28.0 /100 | #192 | Fair $83,628 |
| Finns | 27.7 /100 | #193 | Fair $83,607 |
| Ghanaians | 27.4 /100 | #194 | Fair $83,582 |
| Immigrants | Armenia | 27.0 /100 | #195 | Fair $83,555 |
| French | 26.0 /100 | #196 | Fair $83,468 |
| Aleuts | 25.7 /100 | #197 | Fair $83,446 |