French American Indian vs Nicaraguan Householder Income Ages 25 - 44 years
COMPARE
French American Indian
Nicaraguan
Householder Income Ages 25 - 44 years
Householder Income Ages 25 - 44 years Comparison
French American Indians
Nicaraguans
$85,899
HOUSEHOLDER INCOME AGES 25 - 44 YEARS
0.8/ 100
METRIC RATING
249th/ 347
METRIC RANK
$87,751
HOUSEHOLDER INCOME AGES 25 - 44 YEARS
2.2/ 100
METRIC RATING
240th/ 347
METRIC RANK
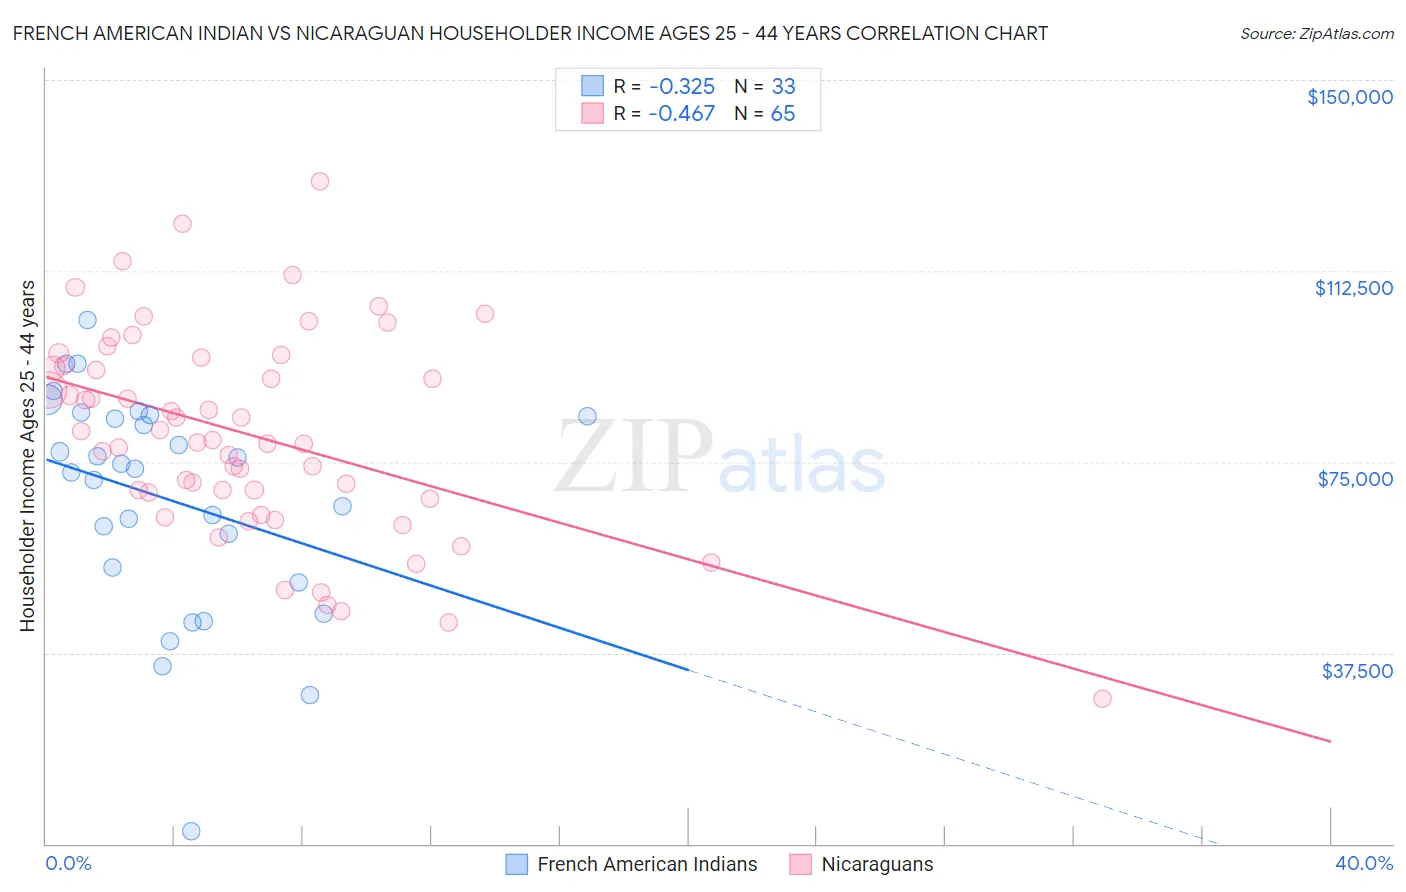
French American Indian vs Nicaraguan Householder Income Ages 25 - 44 years Correlation Chart
The statistical analysis conducted on geographies consisting of 131,864,542 people shows a mild negative correlation between the proportion of French American Indians and household income with householder between the ages 25 and 44 in the United States with a correlation coefficient (R) of -0.325 and weighted average of $85,899. Similarly, the statistical analysis conducted on geographies consisting of 285,307,176 people shows a moderate negative correlation between the proportion of Nicaraguans and household income with householder between the ages 25 and 44 in the United States with a correlation coefficient (R) of -0.467 and weighted average of $87,751, a difference of 2.2%.
Householder Income Ages 25 - 44 years Correlation Summary
| Measurement | French American Indian | Nicaraguan |
| Minimum | $2,499 | $28,500 |
| Maximum | $102,898 | $130,179 |
| Range | $100,399 | $101,679 |
| Mean | $67,668 | $80,440 |
| Median | $73,750 | $79,185 |
| Interquartile 25% (IQ1) | $52,805 | $68,448 |
| Interquartile 75% (IQ3) | $84,046 | $94,672 |
| Interquartile Range (IQR) | $31,241 | $26,224 |
| Standard Deviation (Sample) | $21,873 | $20,031 |
| Standard Deviation (Population) | $21,539 | $19,876 |
Demographics Similar to French American Indians and Nicaraguans by Householder Income Ages 25 - 44 years
In terms of householder income ages 25 - 44 years, the demographic groups most similar to French American Indians are Pennsylvania German ($85,836, a difference of 0.070%), Cape Verdean ($85,758, a difference of 0.16%), Immigrants from Sudan ($86,109, a difference of 0.24%), Immigrants from Western Africa ($85,676, a difference of 0.26%), and British West Indian ($85,565, a difference of 0.39%). Similarly, the demographic groups most similar to Nicaraguans are Immigrants from Ghana ($87,760, a difference of 0.010%), Nigerian ($87,730, a difference of 0.020%), Alaska Native ($88,018, a difference of 0.30%), Salvadoran ($88,198, a difference of 0.51%), and Immigrants from Cameroon ($88,214, a difference of 0.53%).
| Demographics | Rating | Rank | Householder Income Ages 25 - 44 years |
| Venezuelans | 2.9 /100 | #234 | Tragic $88,232 |
| Bermudans | 2.9 /100 | #235 | Tragic $88,231 |
| Immigrants | Cameroon | 2.9 /100 | #236 | Tragic $88,214 |
| Salvadorans | 2.8 /100 | #237 | Tragic $88,198 |
| Alaska Natives | 2.6 /100 | #238 | Tragic $88,018 |
| Immigrants | Ghana | 2.2 /100 | #239 | Tragic $87,760 |
| Nicaraguans | 2.2 /100 | #240 | Tragic $87,751 |
| Nigerians | 2.2 /100 | #241 | Tragic $87,730 |
| West Indians | 1.7 /100 | #242 | Tragic $87,205 |
| Immigrants | West Indies | 1.5 /100 | #243 | Tragic $87,063 |
| Immigrants | Venezuela | 1.5 /100 | #244 | Tragic $87,038 |
| Immigrants | El Salvador | 1.4 /100 | #245 | Tragic $86,913 |
| Immigrants | Burma/Myanmar | 1.3 /100 | #246 | Tragic $86,736 |
| Immigrants | Nigeria | 1.2 /100 | #247 | Tragic $86,589 |
| Immigrants | Sudan | 0.9 /100 | #248 | Tragic $86,109 |
| French American Indians | 0.8 /100 | #249 | Tragic $85,899 |
| Pennsylvania Germans | 0.8 /100 | #250 | Tragic $85,836 |
| Cape Verdeans | 0.8 /100 | #251 | Tragic $85,758 |
| Immigrants | Western Africa | 0.7 /100 | #252 | Tragic $85,676 |
| British West Indians | 0.7 /100 | #253 | Tragic $85,565 |
| Immigrants | Laos | 0.7 /100 | #254 | Tragic $85,553 |