Egyptian vs Nicaraguan Householder Income Ages 25 - 44 years
COMPARE
Egyptian
Nicaraguan
Householder Income Ages 25 - 44 years
Householder Income Ages 25 - 44 years Comparison
Egyptians
Nicaraguans
$105,282
HOUSEHOLDER INCOME AGES 25 - 44 YEARS
99.7/ 100
METRIC RATING
60th/ 347
METRIC RANK
$87,751
HOUSEHOLDER INCOME AGES 25 - 44 YEARS
2.2/ 100
METRIC RATING
240th/ 347
METRIC RANK
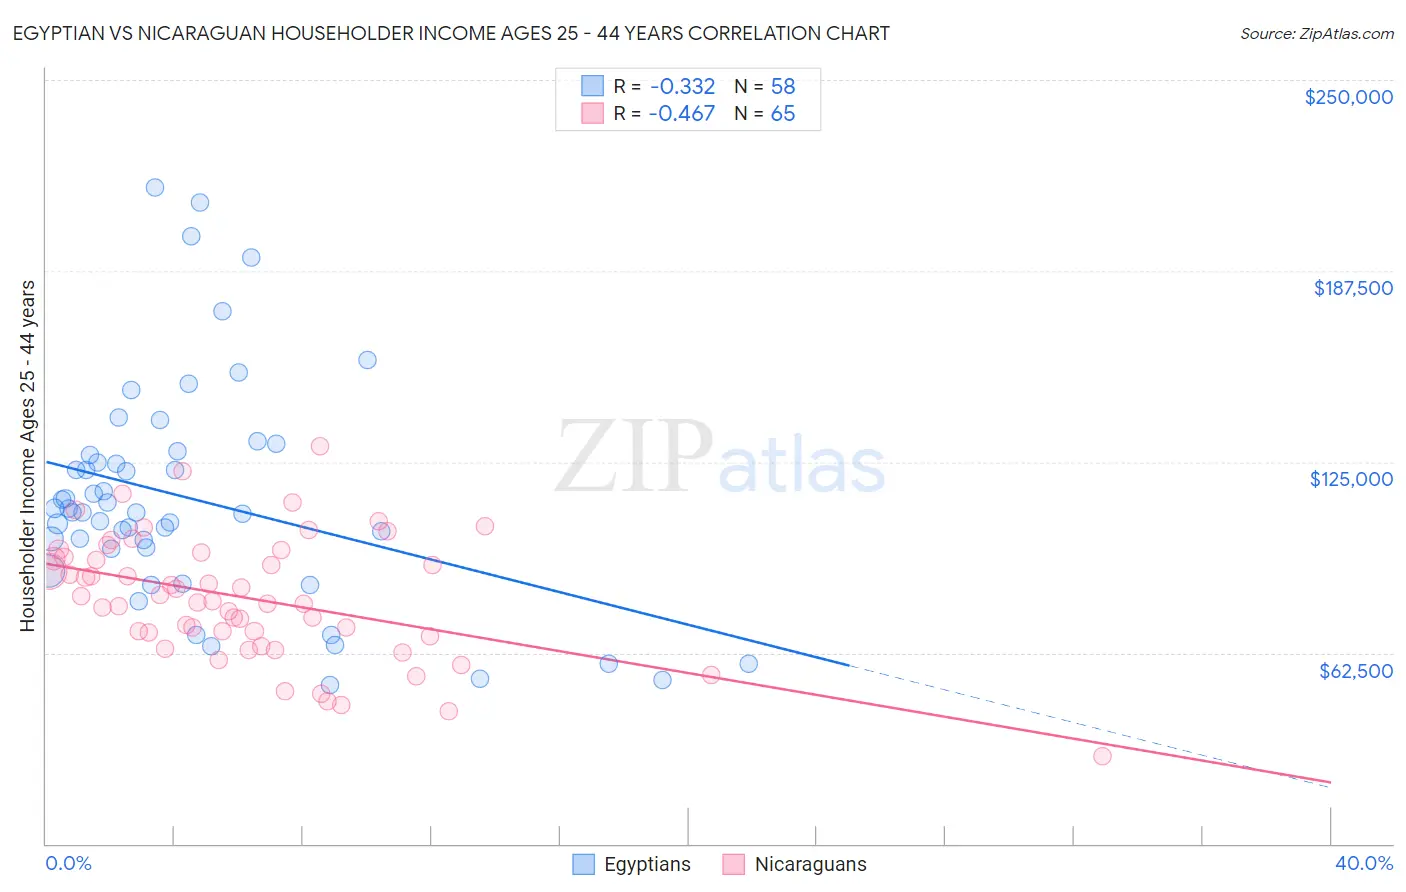
Egyptian vs Nicaraguan Householder Income Ages 25 - 44 years Correlation Chart
The statistical analysis conducted on geographies consisting of 276,427,528 people shows a mild negative correlation between the proportion of Egyptians and household income with householder between the ages 25 and 44 in the United States with a correlation coefficient (R) of -0.332 and weighted average of $105,282. Similarly, the statistical analysis conducted on geographies consisting of 285,307,176 people shows a moderate negative correlation between the proportion of Nicaraguans and household income with householder between the ages 25 and 44 in the United States with a correlation coefficient (R) of -0.467 and weighted average of $87,751, a difference of 20.0%.
Householder Income Ages 25 - 44 years Correlation Summary
| Measurement | Egyptian | Nicaraguan |
| Minimum | $52,083 | $28,500 |
| Maximum | $214,879 | $130,179 |
| Range | $162,796 | $101,679 |
| Mean | $112,843 | $80,440 |
| Median | $108,598 | $79,185 |
| Interquartile 25% (IQ1) | $96,583 | $68,448 |
| Interquartile 75% (IQ3) | $127,216 | $94,672 |
| Interquartile Range (IQR) | $30,633 | $26,224 |
| Standard Deviation (Sample) | $36,905 | $20,031 |
| Standard Deviation (Population) | $36,586 | $19,876 |
Similar Demographics by Householder Income Ages 25 - 44 years
Demographics Similar to Egyptians by Householder Income Ages 25 - 44 years
In terms of householder income ages 25 - 44 years, the demographic groups most similar to Egyptians are Lithuanian ($105,223, a difference of 0.060%), Immigrants from Italy ($105,201, a difference of 0.080%), Immigrants from Scotland ($105,089, a difference of 0.18%), New Zealander ($105,085, a difference of 0.19%), and Immigrants from Netherlands ($105,082, a difference of 0.19%).
| Demographics | Rating | Rank | Householder Income Ages 25 - 44 years |
| Immigrants | Norway | 99.9 /100 | #53 | Exceptional $106,629 |
| Paraguayans | 99.9 /100 | #54 | Exceptional $106,615 |
| Greeks | 99.9 /100 | #55 | Exceptional $106,457 |
| Immigrants | Pakistan | 99.8 /100 | #56 | Exceptional $106,129 |
| Immigrants | Austria | 99.8 /100 | #57 | Exceptional $106,103 |
| Immigrants | South Africa | 99.8 /100 | #58 | Exceptional $105,748 |
| Immigrants | Latvia | 99.8 /100 | #59 | Exceptional $105,522 |
| Egyptians | 99.7 /100 | #60 | Exceptional $105,282 |
| Lithuanians | 99.7 /100 | #61 | Exceptional $105,223 |
| Immigrants | Italy | 99.7 /100 | #62 | Exceptional $105,201 |
| Immigrants | Scotland | 99.7 /100 | #63 | Exceptional $105,089 |
| New Zealanders | 99.7 /100 | #64 | Exceptional $105,085 |
| Immigrants | Netherlands | 99.7 /100 | #65 | Exceptional $105,082 |
| Laotians | 99.7 /100 | #66 | Exceptional $104,993 |
| Immigrants | Romania | 99.6 /100 | #67 | Exceptional $104,713 |
Demographics Similar to Nicaraguans by Householder Income Ages 25 - 44 years
In terms of householder income ages 25 - 44 years, the demographic groups most similar to Nicaraguans are Immigrants from Ghana ($87,760, a difference of 0.010%), Nigerian ($87,730, a difference of 0.020%), Alaska Native ($88,018, a difference of 0.30%), Salvadoran ($88,198, a difference of 0.51%), and Immigrants from Cameroon ($88,214, a difference of 0.53%).
| Demographics | Rating | Rank | Householder Income Ages 25 - 44 years |
| Malaysians | 3.0 /100 | #233 | Tragic $88,291 |
| Venezuelans | 2.9 /100 | #234 | Tragic $88,232 |
| Bermudans | 2.9 /100 | #235 | Tragic $88,231 |
| Immigrants | Cameroon | 2.9 /100 | #236 | Tragic $88,214 |
| Salvadorans | 2.8 /100 | #237 | Tragic $88,198 |
| Alaska Natives | 2.6 /100 | #238 | Tragic $88,018 |
| Immigrants | Ghana | 2.2 /100 | #239 | Tragic $87,760 |
| Nicaraguans | 2.2 /100 | #240 | Tragic $87,751 |
| Nigerians | 2.2 /100 | #241 | Tragic $87,730 |
| West Indians | 1.7 /100 | #242 | Tragic $87,205 |
| Immigrants | West Indies | 1.5 /100 | #243 | Tragic $87,063 |
| Immigrants | Venezuela | 1.5 /100 | #244 | Tragic $87,038 |
| Immigrants | El Salvador | 1.4 /100 | #245 | Tragic $86,913 |
| Immigrants | Burma/Myanmar | 1.3 /100 | #246 | Tragic $86,736 |
| Immigrants | Nigeria | 1.2 /100 | #247 | Tragic $86,589 |