Senegalese vs Immigrants from Trinidad and Tobago Per Capita Income
COMPARE
Senegalese
Immigrants from Trinidad and Tobago
Per Capita Income
Per Capita Income Comparison
Senegalese
Immigrants from Trinidad and Tobago
$41,000
PER CAPITA INCOME
4.8/ 100
METRIC RATING
231st/ 347
METRIC RANK
$41,476
PER CAPITA INCOME
7.9/ 100
METRIC RATING
221st/ 347
METRIC RANK
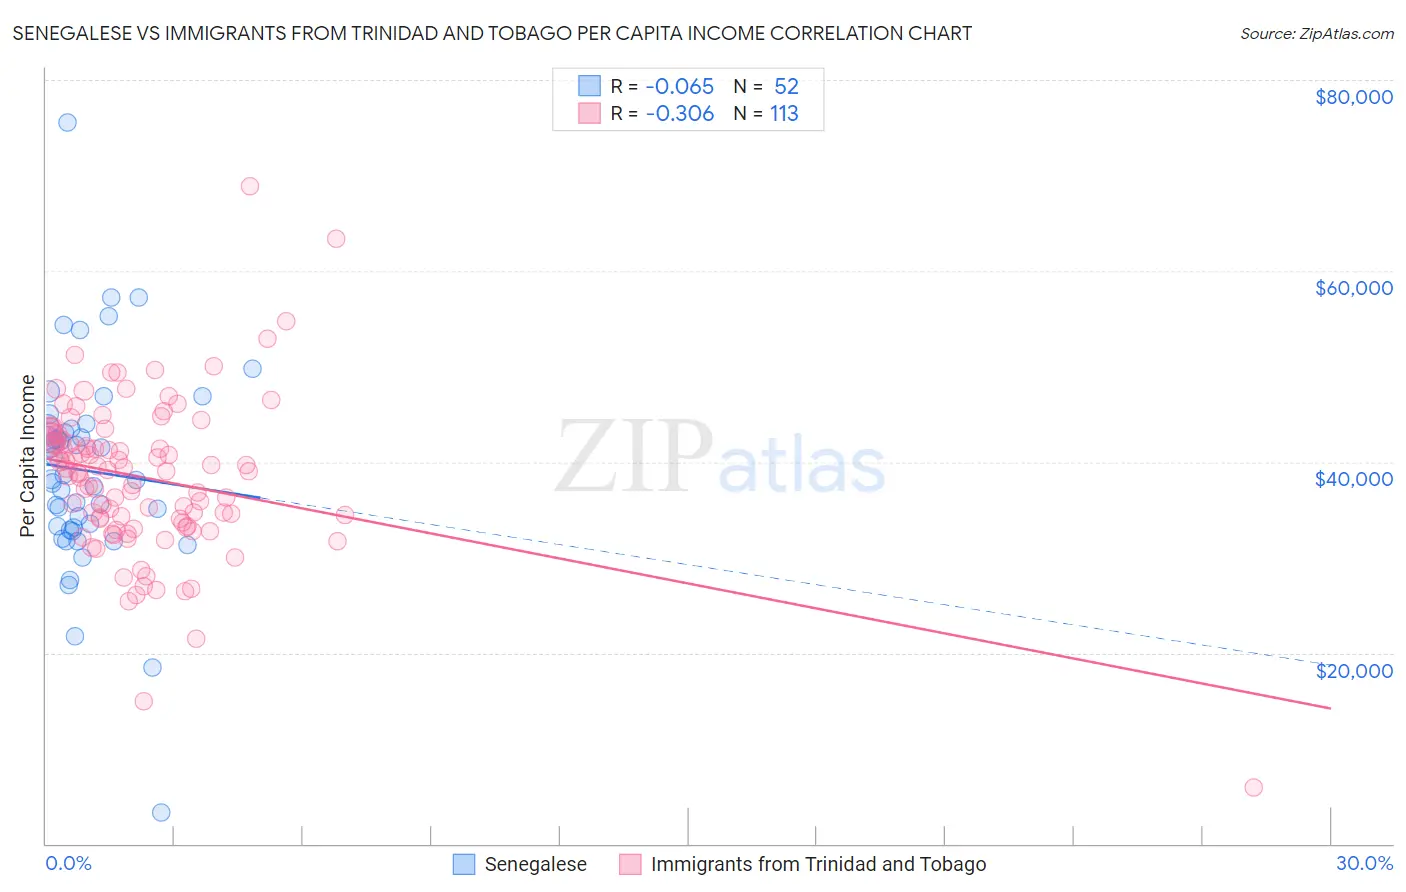
Senegalese vs Immigrants from Trinidad and Tobago Per Capita Income Correlation Chart
The statistical analysis conducted on geographies consisting of 78,107,792 people shows a slight negative correlation between the proportion of Senegalese and per capita income in the United States with a correlation coefficient (R) of -0.065 and weighted average of $41,000. Similarly, the statistical analysis conducted on geographies consisting of 223,544,237 people shows a mild negative correlation between the proportion of Immigrants from Trinidad and Tobago and per capita income in the United States with a correlation coefficient (R) of -0.306 and weighted average of $41,476, a difference of 1.2%.
Per Capita Income Correlation Summary
| Measurement | Senegalese | Immigrants from Trinidad and Tobago |
| Minimum | $3,219 | $5,914 |
| Maximum | $75,539 | $68,888 |
| Range | $72,320 | $62,974 |
| Mean | $39,064 | $38,326 |
| Median | $38,147 | $38,965 |
| Interquartile 25% (IQ1) | $33,014 | $33,457 |
| Interquartile 75% (IQ3) | $43,632 | $42,576 |
| Interquartile Range (IQR) | $10,618 | $9,119 |
| Standard Deviation (Sample) | $10,948 | $8,310 |
| Standard Deviation (Population) | $10,843 | $8,273 |
Demographics Similar to Senegalese and Immigrants from Trinidad and Tobago by Per Capita Income
In terms of per capita income, the demographic groups most similar to Senegalese are Native Hawaiian ($41,017, a difference of 0.040%), Nigerian ($41,026, a difference of 0.060%), Guyanese ($40,949, a difference of 0.12%), Immigrants from Grenada ($41,123, a difference of 0.30%), and Immigrants from Ghana ($41,131, a difference of 0.32%). Similarly, the demographic groups most similar to Immigrants from Trinidad and Tobago are Immigrants from Barbados ($41,478, a difference of 0.0%), Puget Sound Salish ($41,495, a difference of 0.040%), Immigrants from Iraq ($41,365, a difference of 0.27%), Immigrants from Cameroon ($41,334, a difference of 0.34%), and Trinidadian and Tobagonian ($41,655, a difference of 0.43%).
| Demographics | Rating | Rank | Per Capita Income |
| Tongans | 9.9 /100 | #216 | Tragic $41,693 |
| Guamanians/Chamorros | 9.7 /100 | #217 | Tragic $41,678 |
| Trinidadians and Tobagonians | 9.5 /100 | #218 | Tragic $41,655 |
| Puget Sound Salish | 8.1 /100 | #219 | Tragic $41,495 |
| Immigrants | Barbados | 7.9 /100 | #220 | Tragic $41,478 |
| Immigrants | Trinidad and Tobago | 7.9 /100 | #221 | Tragic $41,476 |
| Immigrants | Iraq | 7.1 /100 | #222 | Tragic $41,365 |
| Immigrants | Cameroon | 6.8 /100 | #223 | Tragic $41,334 |
| Immigrants | St. Vincent and the Grenadines | 6.4 /100 | #224 | Tragic $41,270 |
| West Indians | 6.0 /100 | #225 | Tragic $41,217 |
| Immigrants | Ecuador | 5.9 /100 | #226 | Tragic $41,195 |
| Immigrants | Ghana | 5.5 /100 | #227 | Tragic $41,131 |
| Immigrants | Grenada | 5.5 /100 | #228 | Tragic $41,123 |
| Nigerians | 4.9 /100 | #229 | Tragic $41,026 |
| Native Hawaiians | 4.9 /100 | #230 | Tragic $41,017 |
| Senegalese | 4.8 /100 | #231 | Tragic $41,000 |
| Guyanese | 4.5 /100 | #232 | Tragic $40,949 |
| Delaware | 3.8 /100 | #233 | Tragic $40,778 |
| Immigrants | West Indies | 3.7 /100 | #234 | Tragic $40,763 |
| Immigrants | Guyana | 3.6 /100 | #235 | Tragic $40,742 |
| Immigrants | Nonimmigrants | 3.4 /100 | #236 | Tragic $40,669 |