Senegalese vs Samoan Per Capita Income
COMPARE
Senegalese
Samoan
Per Capita Income
Per Capita Income Comparison
Senegalese
Samoans
$41,000
PER CAPITA INCOME
4.8/ 100
METRIC RATING
231st/ 347
METRIC RANK
$39,826
PER CAPITA INCOME
1.3/ 100
METRIC RATING
251st/ 347
METRIC RANK
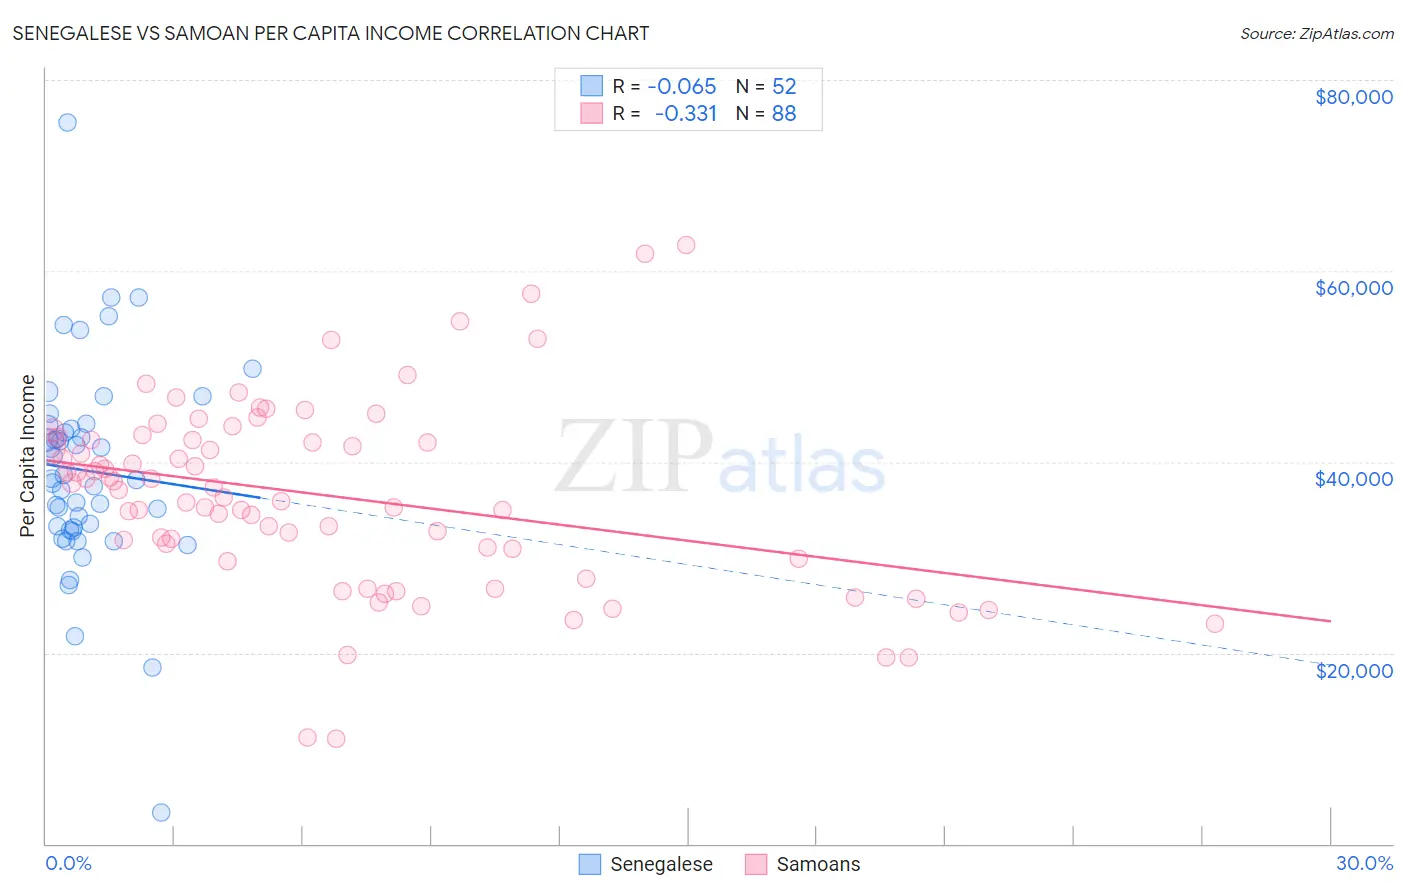
Senegalese vs Samoan Per Capita Income Correlation Chart
The statistical analysis conducted on geographies consisting of 78,107,792 people shows a slight negative correlation between the proportion of Senegalese and per capita income in the United States with a correlation coefficient (R) of -0.065 and weighted average of $41,000. Similarly, the statistical analysis conducted on geographies consisting of 225,205,450 people shows a mild negative correlation between the proportion of Samoans and per capita income in the United States with a correlation coefficient (R) of -0.331 and weighted average of $39,826, a difference of 2.9%.
Per Capita Income Correlation Summary
| Measurement | Senegalese | Samoan |
| Minimum | $3,219 | $10,974 |
| Maximum | $75,539 | $62,755 |
| Range | $72,320 | $51,781 |
| Mean | $39,064 | $36,431 |
| Median | $38,147 | $37,144 |
| Interquartile 25% (IQ1) | $33,014 | $30,385 |
| Interquartile 75% (IQ3) | $43,632 | $42,312 |
| Interquartile Range (IQR) | $10,618 | $11,926 |
| Standard Deviation (Sample) | $10,948 | $9,882 |
| Standard Deviation (Population) | $10,843 | $9,825 |
Demographics Similar to Senegalese and Samoans by Per Capita Income
In terms of per capita income, the demographic groups most similar to Senegalese are Guyanese ($40,949, a difference of 0.12%), Delaware ($40,778, a difference of 0.55%), Immigrants from West Indies ($40,763, a difference of 0.58%), Immigrants from Guyana ($40,742, a difference of 0.63%), and Nonimmigrants ($40,669, a difference of 0.82%). Similarly, the demographic groups most similar to Samoans are Immigrants from Burma/Myanmar ($39,827, a difference of 0.0%), Japanese ($39,870, a difference of 0.11%), Cape Verdean ($39,935, a difference of 0.27%), Immigrants from Somalia ($39,974, a difference of 0.37%), and Cree ($40,056, a difference of 0.58%).
| Demographics | Rating | Rank | Per Capita Income |
| Senegalese | 4.8 /100 | #231 | Tragic $41,000 |
| Guyanese | 4.5 /100 | #232 | Tragic $40,949 |
| Delaware | 3.8 /100 | #233 | Tragic $40,778 |
| Immigrants | West Indies | 3.7 /100 | #234 | Tragic $40,763 |
| Immigrants | Guyana | 3.6 /100 | #235 | Tragic $40,742 |
| Immigrants | Nonimmigrants | 3.4 /100 | #236 | Tragic $40,669 |
| Immigrants | Cambodia | 2.6 /100 | #237 | Tragic $40,434 |
| Somalis | 2.4 /100 | #238 | Tragic $40,367 |
| Tsimshian | 2.4 /100 | #239 | Tragic $40,344 |
| Immigrants | Nigeria | 2.3 /100 | #240 | Tragic $40,339 |
| British West Indians | 2.3 /100 | #241 | Tragic $40,330 |
| Immigrants | Western Africa | 2.2 /100 | #242 | Tragic $40,294 |
| German Russians | 2.2 /100 | #243 | Tragic $40,266 |
| French American Indians | 2.1 /100 | #244 | Tragic $40,244 |
| Sub-Saharan Africans | 1.9 /100 | #245 | Tragic $40,152 |
| Cree | 1.7 /100 | #246 | Tragic $40,056 |
| Immigrants | Somalia | 1.6 /100 | #247 | Tragic $39,974 |
| Cape Verdeans | 1.5 /100 | #248 | Tragic $39,935 |
| Japanese | 1.4 /100 | #249 | Tragic $39,870 |
| Immigrants | Burma/Myanmar | 1.3 /100 | #250 | Tragic $39,827 |
| Samoans | 1.3 /100 | #251 | Tragic $39,826 |