Immigrants from Chile vs Honduran Median Earnings
COMPARE
Immigrants from Chile
Honduran
Median Earnings
Median Earnings Comparison
Immigrants from Chile
Hondurans
$47,697
MEDIAN EARNINGS
85.5/ 100
METRIC RATING
146th/ 347
METRIC RANK
$40,638
MEDIAN EARNINGS
0.0/ 100
METRIC RATING
307th/ 347
METRIC RANK
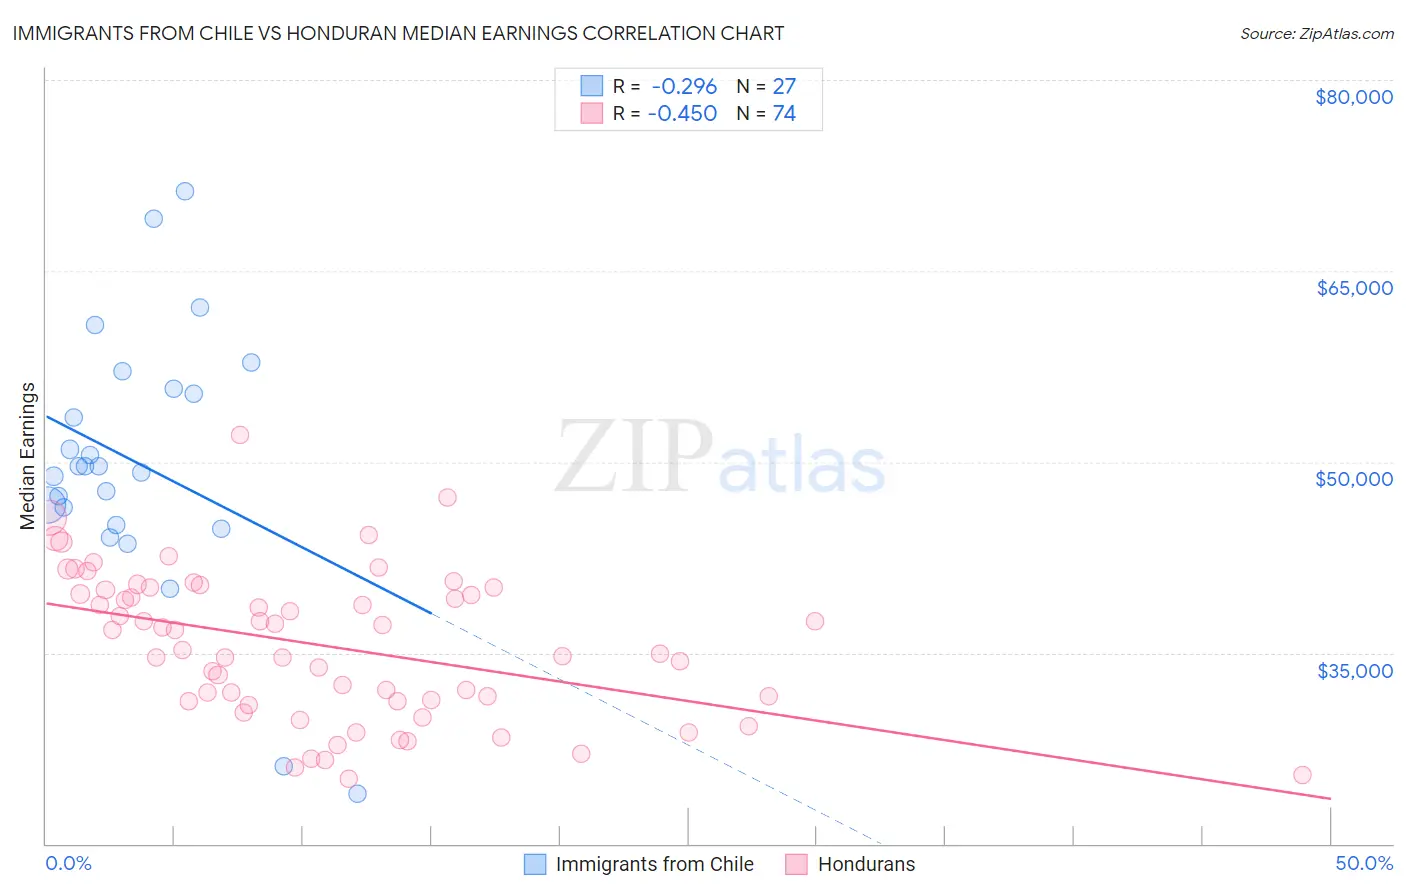
Immigrants from Chile vs Honduran Median Earnings Correlation Chart
The statistical analysis conducted on geographies consisting of 218,645,469 people shows a weak negative correlation between the proportion of Immigrants from Chile and median earnings in the United States with a correlation coefficient (R) of -0.296 and weighted average of $47,697. Similarly, the statistical analysis conducted on geographies consisting of 357,850,602 people shows a moderate negative correlation between the proportion of Hondurans and median earnings in the United States with a correlation coefficient (R) of -0.450 and weighted average of $40,638, a difference of 17.4%.
Median Earnings Correlation Summary
| Measurement | Immigrants from Chile | Honduran |
| Minimum | $23,911 | $25,151 |
| Maximum | $71,250 | $52,125 |
| Range | $47,339 | $26,974 |
| Mean | $49,886 | $35,597 |
| Median | $49,642 | $35,991 |
| Interquartile 25% (IQ1) | $45,024 | $31,224 |
| Interquartile 75% (IQ3) | $55,791 | $39,973 |
| Interquartile Range (IQR) | $10,767 | $8,749 |
| Standard Deviation (Sample) | $10,356 | $5,768 |
| Standard Deviation (Population) | $10,162 | $5,729 |
Similar Demographics by Median Earnings
Demographics Similar to Immigrants from Chile by Median Earnings
In terms of median earnings, the demographic groups most similar to Immigrants from Chile are Immigrants from Saudi Arabia ($47,704, a difference of 0.010%), Immigrants from South Eastern Asia ($47,671, a difference of 0.060%), Immigrants from Eritrea ($47,657, a difference of 0.080%), Luxembourger ($47,640, a difference of 0.12%), and Peruvian ($47,628, a difference of 0.15%).
| Demographics | Rating | Rank | Median Earnings |
| Canadians | 88.8 /100 | #139 | Excellent $47,911 |
| Taiwanese | 88.7 /100 | #140 | Excellent $47,902 |
| Immigrants | Sierra Leone | 88.3 /100 | #141 | Excellent $47,875 |
| Ugandans | 88.0 /100 | #142 | Excellent $47,854 |
| Swedes | 88.0 /100 | #143 | Excellent $47,851 |
| Hungarians | 87.1 /100 | #144 | Excellent $47,795 |
| Immigrants | Saudi Arabia | 85.6 /100 | #145 | Excellent $47,704 |
| Immigrants | Chile | 85.5 /100 | #146 | Excellent $47,697 |
| Immigrants | South Eastern Asia | 85.0 /100 | #147 | Excellent $47,671 |
| Immigrants | Eritrea | 84.8 /100 | #148 | Excellent $47,657 |
| Luxembourgers | 84.5 /100 | #149 | Excellent $47,640 |
| Peruvians | 84.2 /100 | #150 | Excellent $47,628 |
| Immigrants | Oceania | 84.1 /100 | #151 | Excellent $47,617 |
| Immigrants | Germany | 83.1 /100 | #152 | Excellent $47,566 |
| Slavs | 81.1 /100 | #153 | Excellent $47,470 |
Demographics Similar to Hondurans by Median Earnings
In terms of median earnings, the demographic groups most similar to Hondurans are Yaqui ($40,647, a difference of 0.020%), Cuban ($40,619, a difference of 0.050%), Chickasaw ($40,672, a difference of 0.080%), Immigrants from Haiti ($40,550, a difference of 0.22%), and Immigrants from Guatemala ($40,851, a difference of 0.52%).
| Demographics | Rating | Rank | Median Earnings |
| Ute | 0.1 /100 | #300 | Tragic $41,051 |
| Immigrants | Latin America | 0.1 /100 | #301 | Tragic $41,049 |
| Shoshone | 0.0 /100 | #302 | Tragic $40,932 |
| Haitians | 0.0 /100 | #303 | Tragic $40,918 |
| Immigrants | Guatemala | 0.0 /100 | #304 | Tragic $40,851 |
| Chickasaw | 0.0 /100 | #305 | Tragic $40,672 |
| Yaqui | 0.0 /100 | #306 | Tragic $40,647 |
| Hondurans | 0.0 /100 | #307 | Tragic $40,638 |
| Cubans | 0.0 /100 | #308 | Tragic $40,619 |
| Immigrants | Haiti | 0.0 /100 | #309 | Tragic $40,550 |
| Apache | 0.0 /100 | #310 | Tragic $40,388 |
| Hispanics or Latinos | 0.0 /100 | #311 | Tragic $40,288 |
| Chippewa | 0.0 /100 | #312 | Tragic $40,287 |
| Choctaw | 0.0 /100 | #313 | Tragic $40,270 |
| Cheyenne | 0.0 /100 | #314 | Tragic $40,233 |