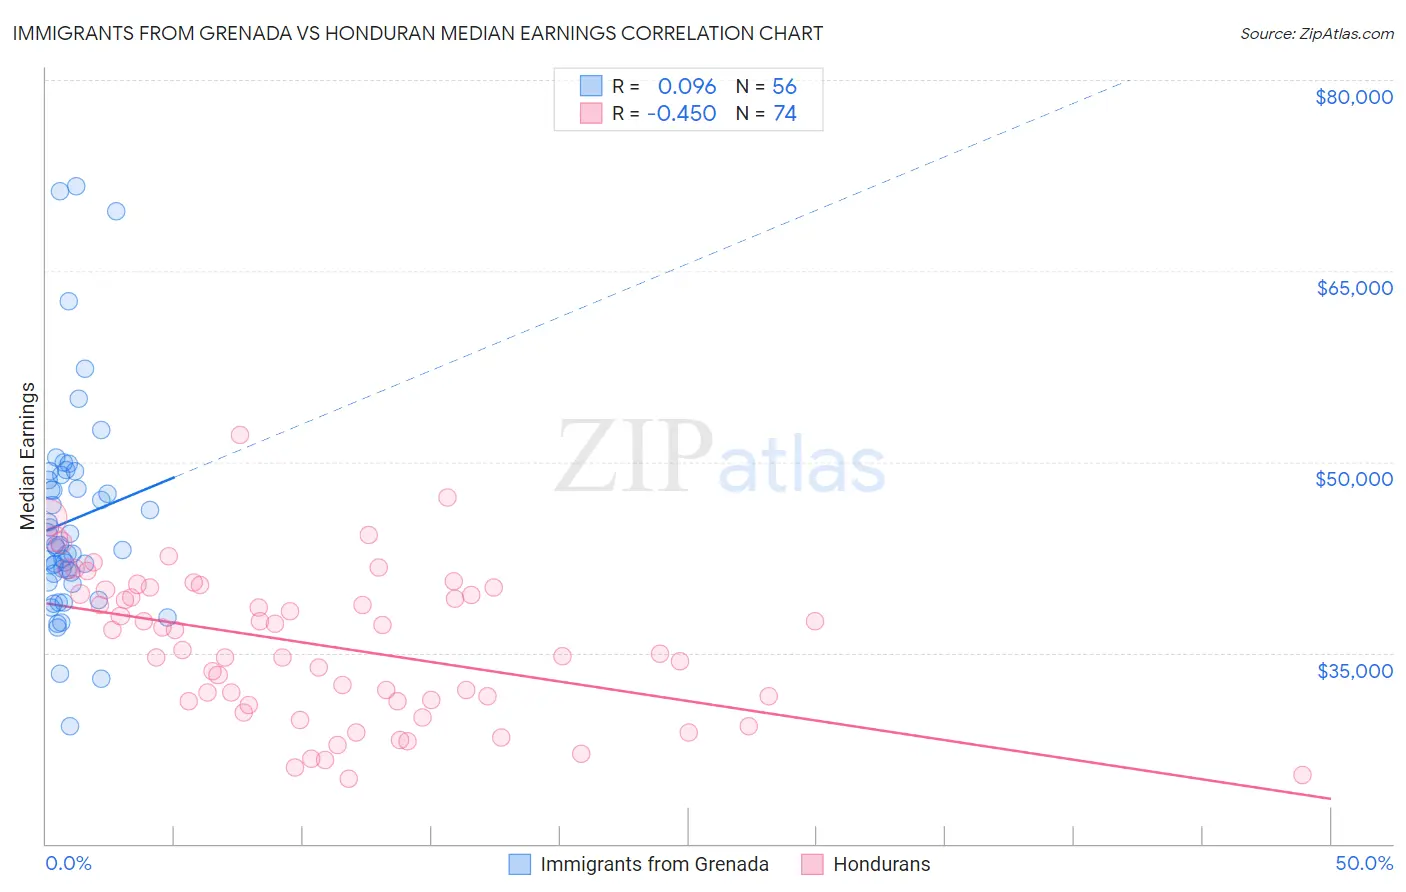
Immigrants from Grenada vs Honduran Median Earnings
COMPARE
Immigrants from Grenada
Honduran
Median Earnings
Median Earnings Comparison
Immigrants from Grenada
Hondurans
$45,596
MEDIAN EARNINGS
23.6/ 100
METRIC RATING
210th/ 347
METRIC RANK
$40,638
MEDIAN EARNINGS
0.0/ 100
METRIC RATING
307th/ 347
METRIC RANK
Immigrants from Grenada vs Honduran Median Earnings Correlation Chart
The statistical analysis conducted on geographies consisting of 67,199,447 people shows a slight positive correlation between the proportion of Immigrants from Grenada and median earnings in the United States with a correlation coefficient (R) of 0.096 and weighted average of $45,596. Similarly, the statistical analysis conducted on geographies consisting of 357,850,602 people shows a moderate negative correlation between the proportion of Hondurans and median earnings in the United States with a correlation coefficient (R) of -0.450 and weighted average of $40,638, a difference of 12.2%.
Median Earnings Correlation Summary
| Measurement | Immigrants from Grenada | Honduran |
| Minimum | $29,237 | $25,151 |
| Maximum | $71,671 | $52,125 |
| Range | $42,434 | $26,974 |
| Mean | $45,405 | $35,597 |
| Median | $43,368 | $35,991 |
| Interquartile 25% (IQ1) | $40,879 | $31,224 |
| Interquartile 75% (IQ3) | $48,789 | $39,973 |
| Interquartile Range (IQR) | $7,911 | $8,749 |
| Standard Deviation (Sample) | $8,458 | $5,768 |
| Standard Deviation (Population) | $8,382 | $5,729 |
Similar Demographics by Median Earnings
Demographics Similar to Immigrants from Grenada by Median Earnings
In terms of median earnings, the demographic groups most similar to Immigrants from Grenada are Immigrants from Thailand ($45,598, a difference of 0.0%), Immigrants from Bosnia and Herzegovina ($45,600, a difference of 0.010%), Panamanian ($45,593, a difference of 0.010%), Bermudan ($45,593, a difference of 0.010%), and Immigrants from Senegal ($45,611, a difference of 0.030%).
| Demographics | Rating | Rank | Median Earnings |
| Welsh | 26.6 /100 | #203 | Fair $45,710 |
| Immigrants | Uruguay | 25.9 /100 | #204 | Fair $45,682 |
| Tongans | 25.4 /100 | #205 | Fair $45,665 |
| Immigrants | Ghana | 24.8 /100 | #206 | Fair $45,641 |
| Immigrants | Senegal | 24.0 /100 | #207 | Fair $45,611 |
| Immigrants | Bosnia and Herzegovina | 23.7 /100 | #208 | Fair $45,600 |
| Immigrants | Thailand | 23.7 /100 | #209 | Fair $45,598 |
| Immigrants | Grenada | 23.6 /100 | #210 | Fair $45,596 |
| Panamanians | 23.5 /100 | #211 | Fair $45,593 |
| Bermudans | 23.5 /100 | #212 | Fair $45,593 |
| Immigrants | Colombia | 22.4 /100 | #213 | Fair $45,550 |
| Nigerians | 22.0 /100 | #214 | Fair $45,532 |
| Immigrants | Bangladesh | 22.0 /100 | #215 | Fair $45,532 |
| Guyanese | 20.6 /100 | #216 | Fair $45,470 |
| Tlingit-Haida | 20.5 /100 | #217 | Fair $45,468 |
Demographics Similar to Hondurans by Median Earnings
In terms of median earnings, the demographic groups most similar to Hondurans are Yaqui ($40,647, a difference of 0.020%), Cuban ($40,619, a difference of 0.050%), Chickasaw ($40,672, a difference of 0.080%), Immigrants from Haiti ($40,550, a difference of 0.22%), and Immigrants from Guatemala ($40,851, a difference of 0.52%).
| Demographics | Rating | Rank | Median Earnings |
| Ute | 0.1 /100 | #300 | Tragic $41,051 |
| Immigrants | Latin America | 0.1 /100 | #301 | Tragic $41,049 |
| Shoshone | 0.0 /100 | #302 | Tragic $40,932 |
| Haitians | 0.0 /100 | #303 | Tragic $40,918 |
| Immigrants | Guatemala | 0.0 /100 | #304 | Tragic $40,851 |
| Chickasaw | 0.0 /100 | #305 | Tragic $40,672 |
| Yaqui | 0.0 /100 | #306 | Tragic $40,647 |
| Hondurans | 0.0 /100 | #307 | Tragic $40,638 |
| Cubans | 0.0 /100 | #308 | Tragic $40,619 |
| Immigrants | Haiti | 0.0 /100 | #309 | Tragic $40,550 |
| Apache | 0.0 /100 | #310 | Tragic $40,388 |
| Hispanics or Latinos | 0.0 /100 | #311 | Tragic $40,288 |
| Chippewa | 0.0 /100 | #312 | Tragic $40,287 |
| Choctaw | 0.0 /100 | #313 | Tragic $40,270 |
| Cheyenne | 0.0 /100 | #314 | Tragic $40,233 |