Seminole vs Spaniard Householder Income Ages 25 - 44 years
COMPARE
Seminole
Spaniard
Householder Income Ages 25 - 44 years
Householder Income Ages 25 - 44 years Comparison
Seminole
Spaniards
$76,584
HOUSEHOLDER INCOME AGES 25 - 44 YEARS
0.0/ 100
METRIC RATING
329th/ 347
METRIC RANK
$93,366
HOUSEHOLDER INCOME AGES 25 - 44 YEARS
34.0/ 100
METRIC RATING
187th/ 347
METRIC RANK
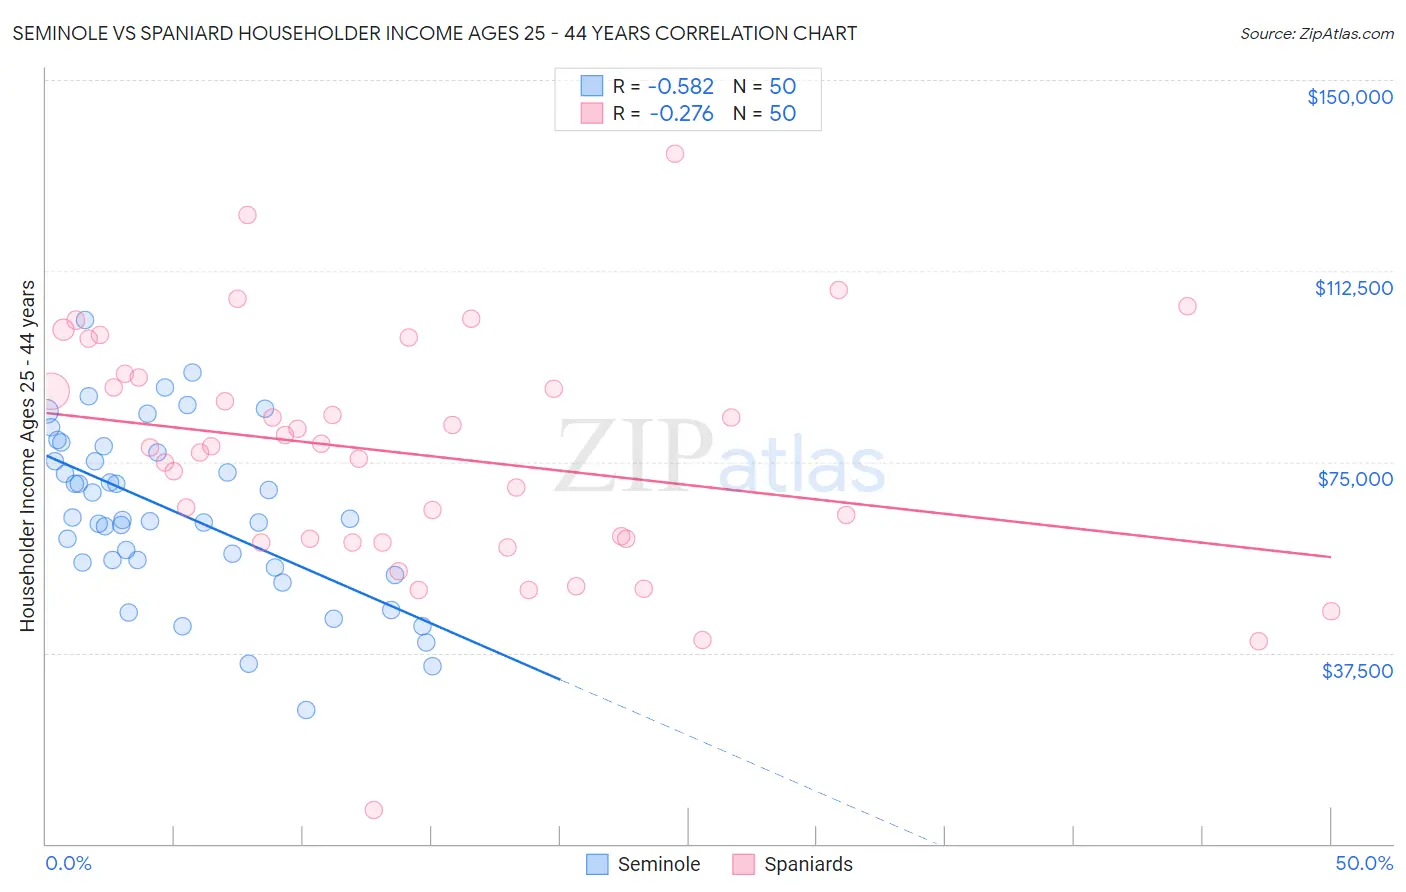
Seminole vs Spaniard Householder Income Ages 25 - 44 years Correlation Chart
The statistical analysis conducted on geographies consisting of 118,219,857 people shows a substantial negative correlation between the proportion of Seminole and household income with householder between the ages 25 and 44 in the United States with a correlation coefficient (R) of -0.582 and weighted average of $76,584. Similarly, the statistical analysis conducted on geographies consisting of 441,839,666 people shows a weak negative correlation between the proportion of Spaniards and household income with householder between the ages 25 and 44 in the United States with a correlation coefficient (R) of -0.276 and weighted average of $93,366, a difference of 21.9%.
Householder Income Ages 25 - 44 years Correlation Summary
| Measurement | Seminole | Spaniard |
| Minimum | $26,250 | $6,532 |
| Maximum | $102,754 | $135,588 |
| Range | $76,504 | $129,056 |
| Mean | $65,024 | $76,452 |
| Median | $63,631 | $77,939 |
| Interquartile 25% (IQ1) | $55,292 | $59,278 |
| Interquartile 75% (IQ3) | $76,875 | $91,655 |
| Interquartile Range (IQR) | $21,583 | $32,377 |
| Standard Deviation (Sample) | $16,561 | $23,796 |
| Standard Deviation (Population) | $16,395 | $23,557 |
Similar Demographics by Householder Income Ages 25 - 44 years
Demographics Similar to Seminole by Householder Income Ages 25 - 44 years
In terms of householder income ages 25 - 44 years, the demographic groups most similar to Seminole are Immigrants from Cuba ($76,701, a difference of 0.15%), Immigrants from Bahamas ($76,910, a difference of 0.42%), Yakama ($76,226, a difference of 0.47%), Houma ($77,044, a difference of 0.60%), and Sioux ($77,089, a difference of 0.66%).
| Demographics | Rating | Rank | Householder Income Ages 25 - 44 years |
| Chickasaw | 0.0 /100 | #322 | Tragic $77,929 |
| Immigrants | Honduras | 0.0 /100 | #323 | Tragic $77,328 |
| Dutch West Indians | 0.0 /100 | #324 | Tragic $77,260 |
| Sioux | 0.0 /100 | #325 | Tragic $77,089 |
| Houma | 0.0 /100 | #326 | Tragic $77,044 |
| Immigrants | Bahamas | 0.0 /100 | #327 | Tragic $76,910 |
| Immigrants | Cuba | 0.0 /100 | #328 | Tragic $76,701 |
| Seminole | 0.0 /100 | #329 | Tragic $76,584 |
| Yakama | 0.0 /100 | #330 | Tragic $76,226 |
| Natives/Alaskans | 0.0 /100 | #331 | Tragic $75,647 |
| Bahamians | 0.0 /100 | #332 | Tragic $75,395 |
| Hopi | 0.0 /100 | #333 | Tragic $75,002 |
| Creek | 0.0 /100 | #334 | Tragic $74,847 |
| Kiowa | 0.0 /100 | #335 | Tragic $74,776 |
| Yup'ik | 0.0 /100 | #336 | Tragic $73,688 |
Demographics Similar to Spaniards by Householder Income Ages 25 - 44 years
In terms of householder income ages 25 - 44 years, the demographic groups most similar to Spaniards are Sierra Leonean ($93,435, a difference of 0.070%), Immigrants from Eritrea ($93,466, a difference of 0.11%), German ($93,531, a difference of 0.18%), Guamanian/Chamorro ($93,569, a difference of 0.22%), and Immigrants from Sierra Leone ($93,115, a difference of 0.27%).
| Demographics | Rating | Rank | Householder Income Ages 25 - 44 years |
| French | 37.8 /100 | #180 | Fair $93,665 |
| Puget Sound Salish | 37.7 /100 | #181 | Fair $93,661 |
| Uruguayans | 37.3 /100 | #182 | Fair $93,631 |
| Guamanians/Chamorros | 36.5 /100 | #183 | Fair $93,569 |
| Germans | 36.0 /100 | #184 | Fair $93,531 |
| Immigrants | Eritrea | 35.2 /100 | #185 | Fair $93,466 |
| Sierra Leoneans | 34.8 /100 | #186 | Fair $93,435 |
| Spaniards | 34.0 /100 | #187 | Fair $93,366 |
| Immigrants | Sierra Leone | 30.9 /100 | #188 | Fair $93,115 |
| Dutch | 30.5 /100 | #189 | Fair $93,081 |
| Welsh | 30.0 /100 | #190 | Fair $93,039 |
| Tlingit-Haida | 29.4 /100 | #191 | Fair $92,987 |
| Immigrants | Costa Rica | 28.2 /100 | #192 | Fair $92,876 |
| Samoans | 23.0 /100 | #193 | Fair $92,385 |
| Immigrants | Azores | 22.4 /100 | #194 | Fair $92,322 |