Seminole vs Chilean Householder Income Ages 25 - 44 years
COMPARE
Seminole
Chilean
Householder Income Ages 25 - 44 years
Householder Income Ages 25 - 44 years Comparison
Seminole
Chileans
$76,584
HOUSEHOLDER INCOME AGES 25 - 44 YEARS
0.0/ 100
METRIC RATING
329th/ 347
METRIC RANK
$99,900
HOUSEHOLDER INCOME AGES 25 - 44 YEARS
95.1/ 100
METRIC RATING
111th/ 347
METRIC RANK
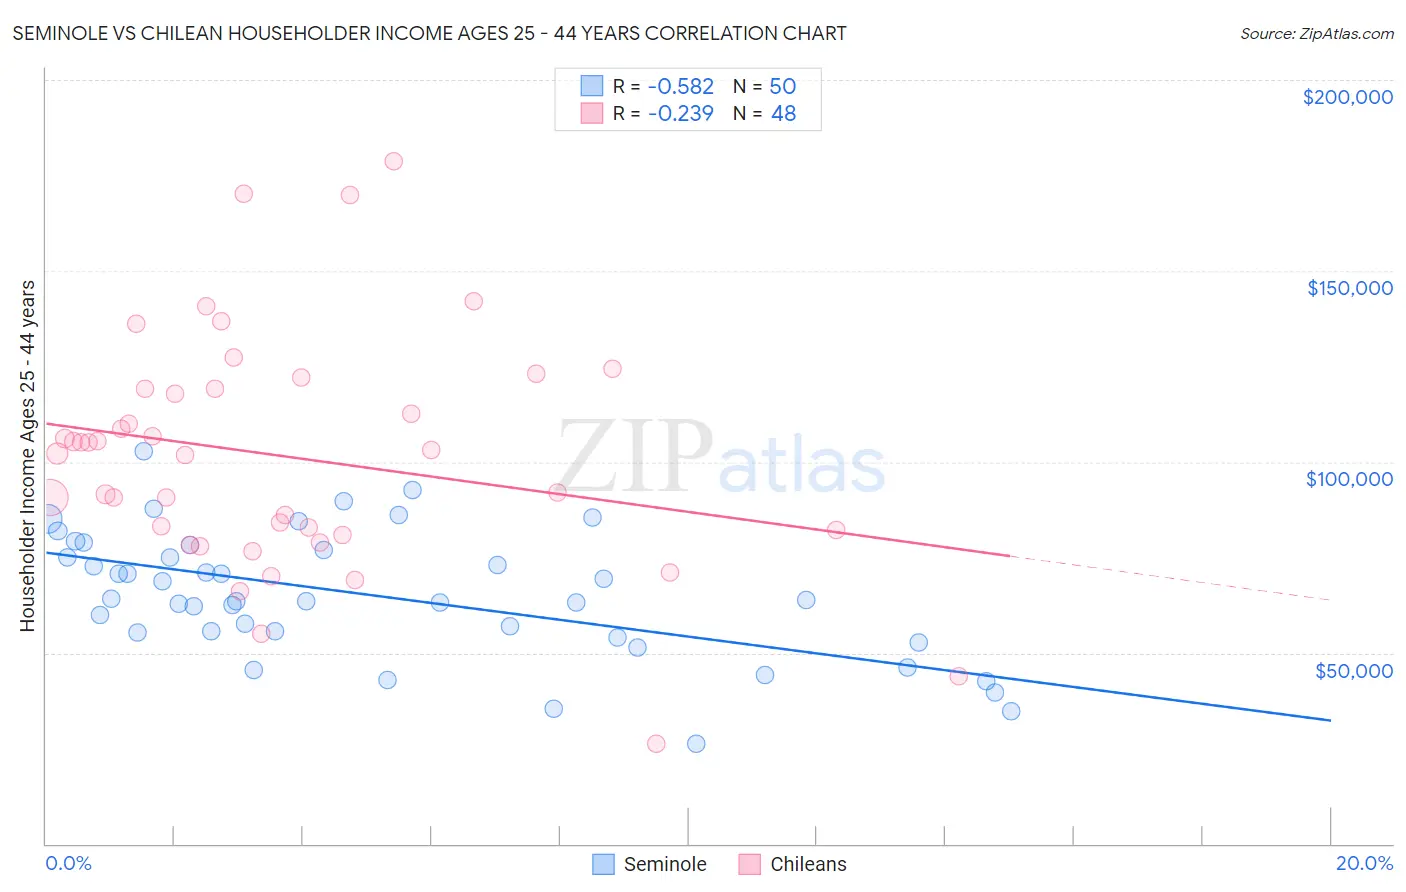
Seminole vs Chilean Householder Income Ages 25 - 44 years Correlation Chart
The statistical analysis conducted on geographies consisting of 118,219,857 people shows a substantial negative correlation between the proportion of Seminole and household income with householder between the ages 25 and 44 in the United States with a correlation coefficient (R) of -0.582 and weighted average of $76,584. Similarly, the statistical analysis conducted on geographies consisting of 256,390,740 people shows a weak negative correlation between the proportion of Chileans and household income with householder between the ages 25 and 44 in the United States with a correlation coefficient (R) of -0.239 and weighted average of $99,900, a difference of 30.4%.
Householder Income Ages 25 - 44 years Correlation Summary
| Measurement | Seminole | Chilean |
| Minimum | $26,250 | $26,028 |
| Maximum | $102,754 | $178,828 |
| Range | $76,504 | $152,800 |
| Mean | $65,024 | $101,398 |
| Median | $63,631 | $102,616 |
| Interquartile 25% (IQ1) | $55,292 | $81,519 |
| Interquartile 75% (IQ3) | $76,875 | $119,228 |
| Interquartile Range (IQR) | $21,583 | $37,709 |
| Standard Deviation (Sample) | $16,561 | $30,801 |
| Standard Deviation (Population) | $16,395 | $30,478 |
Similar Demographics by Householder Income Ages 25 - 44 years
Demographics Similar to Seminole by Householder Income Ages 25 - 44 years
In terms of householder income ages 25 - 44 years, the demographic groups most similar to Seminole are Immigrants from Cuba ($76,701, a difference of 0.15%), Immigrants from Bahamas ($76,910, a difference of 0.42%), Yakama ($76,226, a difference of 0.47%), Houma ($77,044, a difference of 0.60%), and Sioux ($77,089, a difference of 0.66%).
| Demographics | Rating | Rank | Householder Income Ages 25 - 44 years |
| Chickasaw | 0.0 /100 | #322 | Tragic $77,929 |
| Immigrants | Honduras | 0.0 /100 | #323 | Tragic $77,328 |
| Dutch West Indians | 0.0 /100 | #324 | Tragic $77,260 |
| Sioux | 0.0 /100 | #325 | Tragic $77,089 |
| Houma | 0.0 /100 | #326 | Tragic $77,044 |
| Immigrants | Bahamas | 0.0 /100 | #327 | Tragic $76,910 |
| Immigrants | Cuba | 0.0 /100 | #328 | Tragic $76,701 |
| Seminole | 0.0 /100 | #329 | Tragic $76,584 |
| Yakama | 0.0 /100 | #330 | Tragic $76,226 |
| Natives/Alaskans | 0.0 /100 | #331 | Tragic $75,647 |
| Bahamians | 0.0 /100 | #332 | Tragic $75,395 |
| Hopi | 0.0 /100 | #333 | Tragic $75,002 |
| Creek | 0.0 /100 | #334 | Tragic $74,847 |
| Kiowa | 0.0 /100 | #335 | Tragic $74,776 |
| Yup'ik | 0.0 /100 | #336 | Tragic $73,688 |
Demographics Similar to Chileans by Householder Income Ages 25 - 44 years
In terms of householder income ages 25 - 44 years, the demographic groups most similar to Chileans are Immigrants from Afghanistan ($99,977, a difference of 0.080%), Immigrants from North Macedonia ($100,101, a difference of 0.20%), Polish ($99,685, a difference of 0.22%), Tongan ($99,604, a difference of 0.30%), and Immigrants from South Eastern Asia ($100,283, a difference of 0.38%).
| Demographics | Rating | Rank | Householder Income Ages 25 - 44 years |
| Immigrants | Poland | 97.4 /100 | #104 | Exceptional $101,065 |
| Immigrants | Vietnam | 96.5 /100 | #105 | Exceptional $100,535 |
| Immigrants | Brazil | 96.5 /100 | #106 | Exceptional $100,534 |
| Northern Europeans | 96.3 /100 | #107 | Exceptional $100,457 |
| Immigrants | South Eastern Asia | 96.0 /100 | #108 | Exceptional $100,283 |
| Immigrants | North Macedonia | 95.6 /100 | #109 | Exceptional $100,101 |
| Immigrants | Afghanistan | 95.3 /100 | #110 | Exceptional $99,977 |
| Chileans | 95.1 /100 | #111 | Exceptional $99,900 |
| Poles | 94.5 /100 | #112 | Exceptional $99,685 |
| Tongans | 94.2 /100 | #113 | Exceptional $99,604 |
| Immigrants | Western Asia | 94.0 /100 | #114 | Exceptional $99,516 |
| Carpatho Rusyns | 93.7 /100 | #115 | Exceptional $99,449 |
| Portuguese | 93.7 /100 | #116 | Exceptional $99,429 |
| Immigrants | Northern Africa | 93.0 /100 | #117 | Exceptional $99,232 |
| Syrians | 92.9 /100 | #118 | Exceptional $99,215 |