Scandinavian vs Immigrants from Ecuador Median Household Income
COMPARE
Scandinavian
Immigrants from Ecuador
Median Household Income
Median Household Income Comparison
Scandinavians
Immigrants from Ecuador
$86,073
MEDIAN HOUSEHOLD INCOME
65.1/ 100
METRIC RATING
166th/ 347
METRIC RANK
$80,341
MEDIAN HOUSEHOLD INCOME
4.5/ 100
METRIC RATING
234th/ 347
METRIC RANK
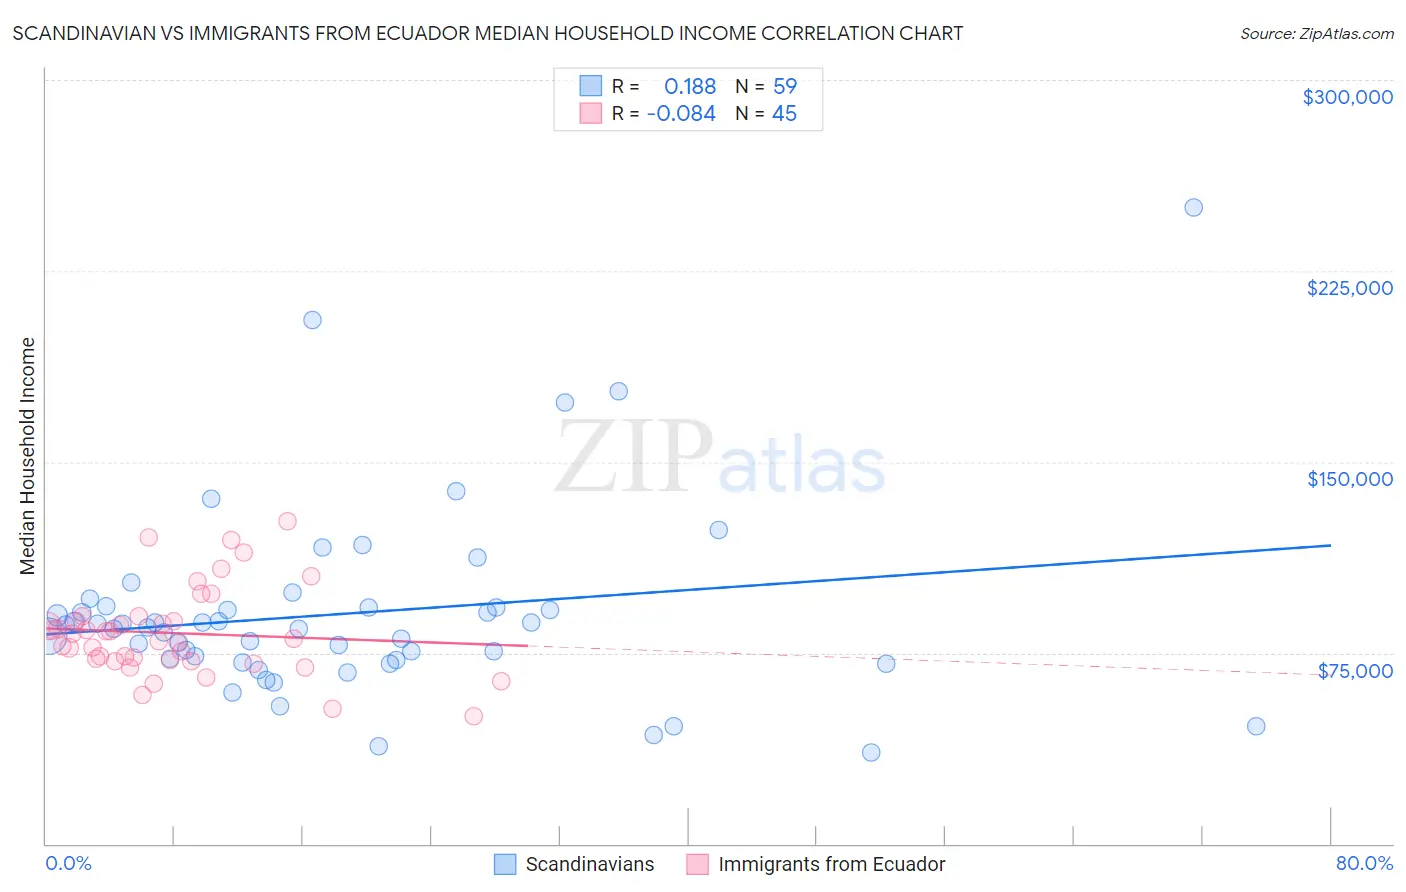
Scandinavian vs Immigrants from Ecuador Median Household Income Correlation Chart
The statistical analysis conducted on geographies consisting of 472,110,165 people shows a poor positive correlation between the proportion of Scandinavians and median household income in the United States with a correlation coefficient (R) of 0.188 and weighted average of $86,073. Similarly, the statistical analysis conducted on geographies consisting of 270,856,843 people shows a slight negative correlation between the proportion of Immigrants from Ecuador and median household income in the United States with a correlation coefficient (R) of -0.084 and weighted average of $80,341, a difference of 7.1%.
Median Household Income Correlation Summary
| Measurement | Scandinavian | Immigrants from Ecuador |
| Minimum | $35,625 | $49,886 |
| Maximum | $250,001 | $126,873 |
| Range | $214,376 | $76,987 |
| Mean | $90,420 | $82,745 |
| Median | $84,951 | $80,365 |
| Interquartile 25% (IQ1) | $72,386 | $72,009 |
| Interquartile 75% (IQ3) | $92,885 | $88,454 |
| Interquartile Range (IQR) | $20,499 | $16,444 |
| Standard Deviation (Sample) | $37,436 | $17,127 |
| Standard Deviation (Population) | $37,118 | $16,935 |
Similar Demographics by Median Household Income
Demographics Similar to Scandinavians by Median Household Income
In terms of median household income, the demographic groups most similar to Scandinavians are Norwegian ($86,084, a difference of 0.010%), Irish ($86,145, a difference of 0.080%), Czech ($86,164, a difference of 0.11%), Guamanian/Chamorro ($86,255, a difference of 0.21%), and Immigrants ($85,818, a difference of 0.30%).
| Demographics | Rating | Rank | Median Household Income |
| Immigrants | Uzbekistan | 70.1 /100 | #159 | Good $86,425 |
| Luxembourgers | 70.0 /100 | #160 | Good $86,418 |
| Slavs | 69.7 /100 | #161 | Good $86,398 |
| Guamanians/Chamorros | 67.7 /100 | #162 | Good $86,255 |
| Czechs | 66.4 /100 | #163 | Good $86,164 |
| Irish | 66.2 /100 | #164 | Good $86,145 |
| Norwegians | 65.3 /100 | #165 | Good $86,084 |
| Scandinavians | 65.1 /100 | #166 | Good $86,073 |
| Immigrants | Immigrants | 61.3 /100 | #167 | Good $85,818 |
| Icelanders | 61.0 /100 | #168 | Good $85,797 |
| Colombians | 59.7 /100 | #169 | Average $85,716 |
| Swiss | 59.2 /100 | #170 | Average $85,681 |
| Immigrants | South America | 58.1 /100 | #171 | Average $85,611 |
| Slovenes | 57.4 /100 | #172 | Average $85,562 |
| Immigrants | Cameroon | 53.4 /100 | #173 | Average $85,314 |
Demographics Similar to Immigrants from Ecuador by Median Household Income
In terms of median household income, the demographic groups most similar to Immigrants from Ecuador are Immigrants from the Azores ($80,357, a difference of 0.020%), Immigrants from Guyana ($80,324, a difference of 0.020%), Immigrants from Trinidad and Tobago ($80,373, a difference of 0.040%), Bermudan ($80,406, a difference of 0.080%), and Trinidadian and Tobagonian ($80,402, a difference of 0.080%).
| Demographics | Rating | Rank | Median Household Income |
| Guyanese | 5.7 /100 | #227 | Tragic $80,734 |
| Immigrants | Bangladesh | 5.7 /100 | #228 | Tragic $80,722 |
| Delaware | 5.0 /100 | #229 | Tragic $80,527 |
| Bermudans | 4.7 /100 | #230 | Tragic $80,406 |
| Trinidadians and Tobagonians | 4.7 /100 | #231 | Tragic $80,402 |
| Immigrants | Trinidad and Tobago | 4.6 /100 | #232 | Tragic $80,373 |
| Immigrants | Azores | 4.5 /100 | #233 | Tragic $80,357 |
| Immigrants | Ecuador | 4.5 /100 | #234 | Tragic $80,341 |
| Immigrants | Guyana | 4.5 /100 | #235 | Tragic $80,324 |
| Immigrants | Bosnia and Herzegovina | 3.4 /100 | #236 | Tragic $79,888 |
| Nicaraguans | 3.1 /100 | #237 | Tragic $79,737 |
| Barbadians | 3.0 /100 | #238 | Tragic $79,664 |
| Alaska Natives | 2.7 /100 | #239 | Tragic $79,509 |
| Immigrants | Western Africa | 2.7 /100 | #240 | Tragic $79,490 |
| Immigrants | Nonimmigrants | 2.6 /100 | #241 | Tragic $79,429 |