Scandinavian vs British Median Family Income
COMPARE
Scandinavian
British
Median Family Income
Median Family Income Comparison
Scandinavians
British
$104,410
MEDIAN FAMILY INCOME
70.8/ 100
METRIC RATING
158th/ 347
METRIC RANK
$108,705
MEDIAN FAMILY INCOME
95.6/ 100
METRIC RATING
110th/ 347
METRIC RANK
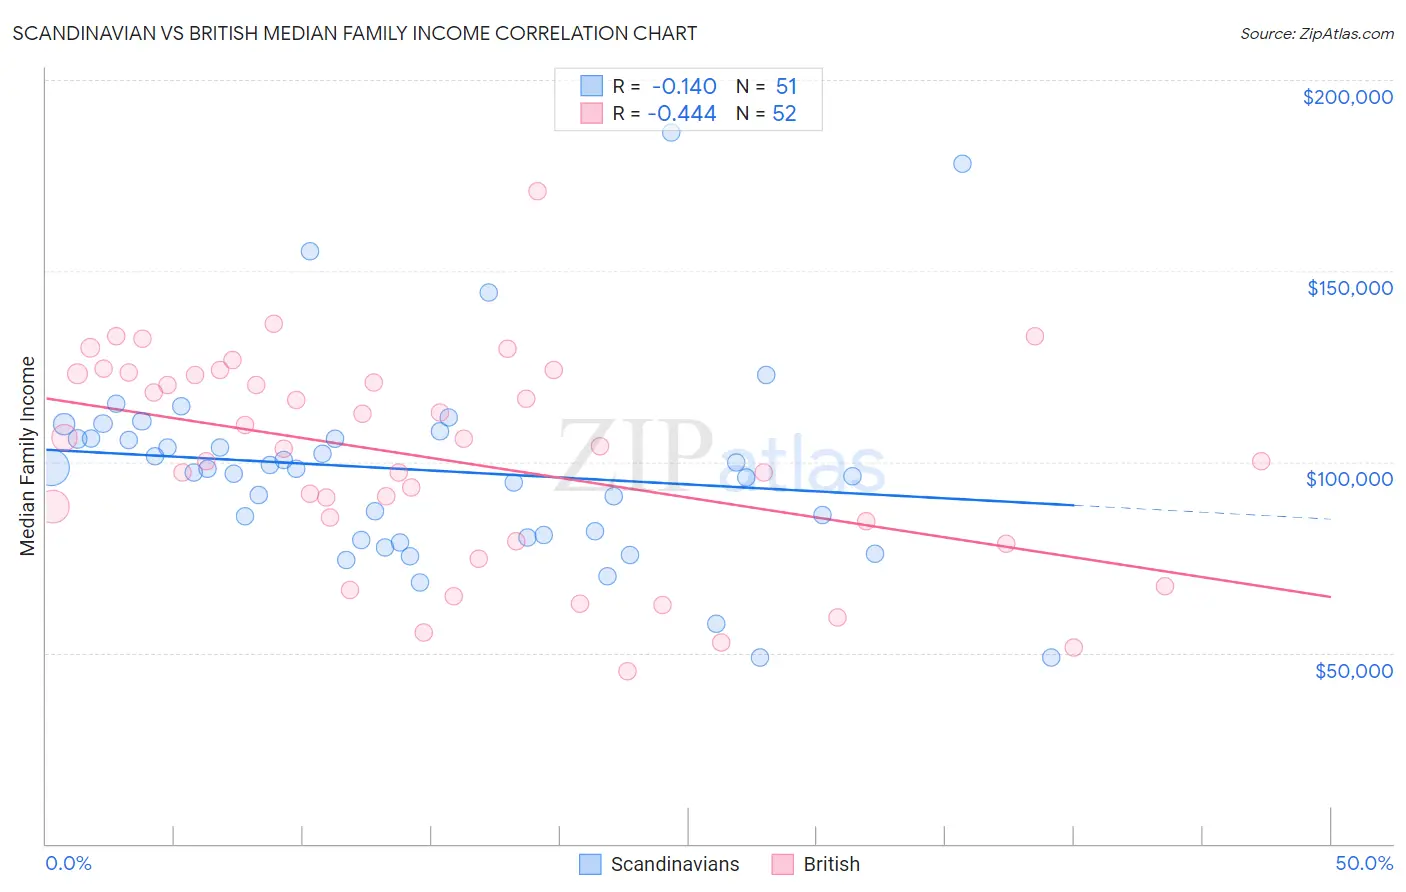
Scandinavian vs British Median Family Income Correlation Chart
The statistical analysis conducted on geographies consisting of 472,034,552 people shows a poor negative correlation between the proportion of Scandinavians and median family income in the United States with a correlation coefficient (R) of -0.140 and weighted average of $104,410. Similarly, the statistical analysis conducted on geographies consisting of 530,672,110 people shows a moderate negative correlation between the proportion of British and median family income in the United States with a correlation coefficient (R) of -0.444 and weighted average of $108,705, a difference of 4.1%.
Median Family Income Correlation Summary
| Measurement | Scandinavian | British |
| Minimum | $48,750 | $45,060 |
| Maximum | $186,250 | $170,856 |
| Range | $137,500 | $125,796 |
| Mean | $97,868 | $100,714 |
| Median | $98,046 | $103,902 |
| Interquartile 25% (IQ1) | $80,113 | $81,768 |
| Interquartile 75% (IQ3) | $106,098 | $123,002 |
| Interquartile Range (IQR) | $25,985 | $41,234 |
| Standard Deviation (Sample) | $26,299 | $27,270 |
| Standard Deviation (Population) | $26,040 | $27,007 |
Similar Demographics by Median Family Income
Demographics Similar to Scandinavians by Median Family Income
In terms of median family income, the demographic groups most similar to Scandinavians are Swiss ($104,396, a difference of 0.010%), Moroccan ($104,488, a difference of 0.080%), Scottish ($104,288, a difference of 0.12%), Icelander ($104,282, a difference of 0.12%), and Basque ($104,760, a difference of 0.34%).
| Demographics | Rating | Rank | Median Family Income |
| Peruvians | 80.4 /100 | #151 | Excellent $105,444 |
| Immigrants | Albania | 79.1 /100 | #152 | Good $105,285 |
| Slavs | 77.9 /100 | #153 | Good $105,144 |
| Immigrants | Nepal | 76.3 /100 | #154 | Good $104,966 |
| Native Hawaiians | 75.8 /100 | #155 | Good $104,910 |
| Basques | 74.4 /100 | #156 | Good $104,760 |
| Moroccans | 71.6 /100 | #157 | Good $104,488 |
| Scandinavians | 70.8 /100 | #158 | Good $104,410 |
| Swiss | 70.7 /100 | #159 | Good $104,396 |
| Scottish | 69.5 /100 | #160 | Good $104,288 |
| Icelanders | 69.4 /100 | #161 | Good $104,282 |
| Immigrants | Sierra Leone | 66.2 /100 | #162 | Good $103,990 |
| Costa Ricans | 66.2 /100 | #163 | Good $103,989 |
| Sierra Leoneans | 64.7 /100 | #164 | Good $103,859 |
| Slovaks | 63.1 /100 | #165 | Good $103,729 |
Demographics Similar to British by Median Family Income
In terms of median family income, the demographic groups most similar to British are Immigrants from Afghanistan ($108,709, a difference of 0.0%), Immigrants from Western Asia ($108,691, a difference of 0.010%), Immigrants from Zimbabwe ($108,830, a difference of 0.12%), Immigrants from Poland ($108,570, a difference of 0.12%), and Immigrants from Saudi Arabia ($108,544, a difference of 0.15%).
| Demographics | Rating | Rank | Median Family Income |
| Immigrants | Brazil | 96.9 /100 | #103 | Exceptional $109,418 |
| Palestinians | 96.9 /100 | #104 | Exceptional $109,413 |
| Syrians | 96.7 /100 | #105 | Exceptional $109,299 |
| Albanians | 96.4 /100 | #106 | Exceptional $109,136 |
| Immigrants | North Macedonia | 96.4 /100 | #107 | Exceptional $109,136 |
| Immigrants | Zimbabwe | 95.9 /100 | #108 | Exceptional $108,830 |
| Immigrants | Afghanistan | 95.6 /100 | #109 | Exceptional $108,709 |
| British | 95.6 /100 | #110 | Exceptional $108,705 |
| Immigrants | Western Asia | 95.6 /100 | #111 | Exceptional $108,691 |
| Immigrants | Poland | 95.3 /100 | #112 | Exceptional $108,570 |
| Immigrants | Saudi Arabia | 95.2 /100 | #113 | Exceptional $108,544 |
| Poles | 95.2 /100 | #114 | Exceptional $108,507 |
| Swedes | 95.1 /100 | #115 | Exceptional $108,499 |
| Chileans | 95.0 /100 | #116 | Exceptional $108,429 |
| Immigrants | Philippines | 94.6 /100 | #117 | Exceptional $108,288 |