Samoan vs Laotian High School Diploma
COMPARE
Samoan
Laotian
High School Diploma
High School Diploma Comparison
Samoans
Laotians
88.5%
HIGH SCHOOL DIPLOMA
14.0/ 100
METRIC RATING
210th/ 347
METRIC RANK
89.3%
HIGH SCHOOL DIPLOMA
61.8/ 100
METRIC RATING
160th/ 347
METRIC RANK
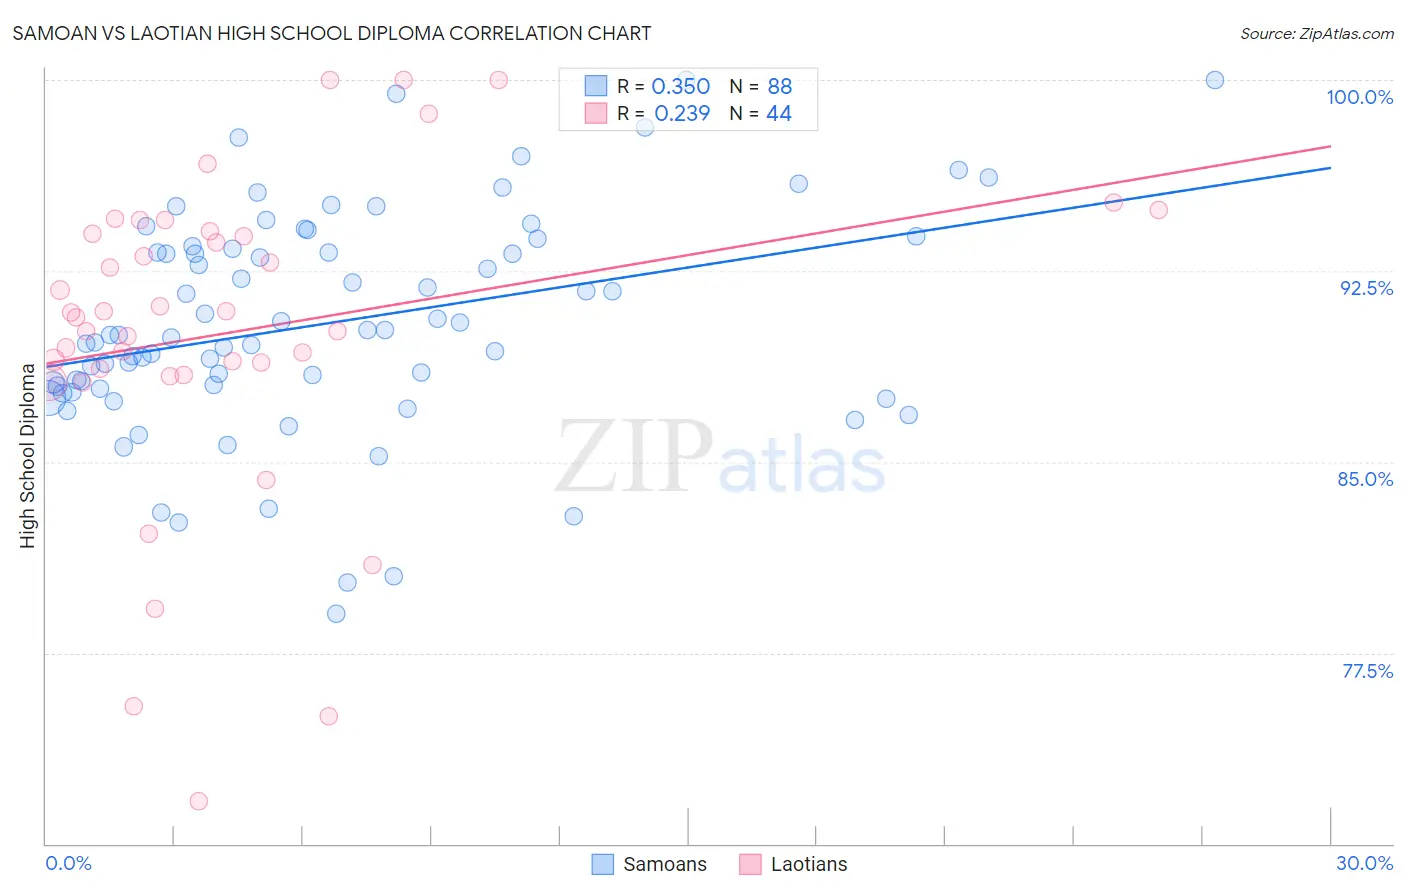
Samoan vs Laotian High School Diploma Correlation Chart
The statistical analysis conducted on geographies consisting of 225,205,998 people shows a mild positive correlation between the proportion of Samoans and percentage of population with at least high school diploma education in the United States with a correlation coefficient (R) of 0.350 and weighted average of 88.5%. Similarly, the statistical analysis conducted on geographies consisting of 224,854,130 people shows a weak positive correlation between the proportion of Laotians and percentage of population with at least high school diploma education in the United States with a correlation coefficient (R) of 0.239 and weighted average of 89.3%, a difference of 0.87%.
High School Diploma Correlation Summary
| Measurement | Samoan | Laotian |
| Minimum | 79.0% | 71.7% |
| Maximum | 100.0% | 100.0% |
| Range | 21.0% | 28.3% |
| Mean | 90.5% | 90.1% |
| Median | 90.0% | 90.8% |
| Interquartile 25% (IQ1) | 87.9% | 88.6% |
| Interquartile 75% (IQ3) | 93.4% | 94.0% |
| Interquartile Range (IQR) | 5.5% | 5.5% |
| Standard Deviation (Sample) | 4.3% | 6.3% |
| Standard Deviation (Population) | 4.3% | 6.2% |
Similar Demographics by High School Diploma
Demographics Similar to Samoans by High School Diploma
In terms of high school diploma, the demographic groups most similar to Samoans are Portuguese (88.5%, a difference of 0.010%), Cherokee (88.5%, a difference of 0.010%), Inupiat (88.5%, a difference of 0.030%), Immigrants from Sierra Leone (88.6%, a difference of 0.050%), and Arapaho (88.6%, a difference of 0.060%).
| Demographics | Rating | Rank | High School Diploma |
| Somalis | 17.5 /100 | #203 | Poor 88.6% |
| Armenians | 17.2 /100 | #204 | Poor 88.6% |
| Immigrants | Micronesia | 16.4 /100 | #205 | Poor 88.6% |
| Arapaho | 16.1 /100 | #206 | Poor 88.6% |
| Immigrants | Sierra Leone | 15.8 /100 | #207 | Poor 88.6% |
| Portuguese | 14.4 /100 | #208 | Poor 88.5% |
| Cherokee | 14.3 /100 | #209 | Poor 88.5% |
| Samoans | 14.0 /100 | #210 | Poor 88.5% |
| Inupiat | 13.1 /100 | #211 | Poor 88.5% |
| South American Indians | 12.2 /100 | #212 | Poor 88.5% |
| Immigrants | Somalia | 11.3 /100 | #213 | Poor 88.4% |
| Immigrants | Cameroon | 10.9 /100 | #214 | Poor 88.4% |
| Crow | 10.9 /100 | #215 | Poor 88.4% |
| Chickasaw | 10.7 /100 | #216 | Poor 88.4% |
| Immigrants | Africa | 10.6 /100 | #217 | Poor 88.4% |
Demographics Similar to Laotians by High School Diploma
In terms of high school diploma, the demographic groups most similar to Laotians are Immigrants from China (89.3%, a difference of 0.0%), Immigrants from Pakistan (89.3%, a difference of 0.010%), Brazilian (89.3%, a difference of 0.010%), Bermudan (89.3%, a difference of 0.010%), and Cree (89.3%, a difference of 0.010%).
| Demographics | Rating | Rank | High School Diploma |
| Immigrants | Iraq | 68.7 /100 | #153 | Good 89.4% |
| Alsatians | 66.8 /100 | #154 | Good 89.4% |
| Immigrants | Northern Africa | 66.4 /100 | #155 | Good 89.4% |
| Immigrants | Argentina | 65.5 /100 | #156 | Good 89.4% |
| Immigrants | Malaysia | 63.5 /100 | #157 | Good 89.3% |
| Immigrants | Pakistan | 62.5 /100 | #158 | Good 89.3% |
| Immigrants | China | 62.0 /100 | #159 | Good 89.3% |
| Laotians | 61.8 /100 | #160 | Good 89.3% |
| Brazilians | 61.2 /100 | #161 | Good 89.3% |
| Bermudans | 61.1 /100 | #162 | Good 89.3% |
| Cree | 61.1 /100 | #163 | Good 89.3% |
| Immigrants | Nepal | 61.1 /100 | #164 | Good 89.3% |
| Immigrants | Asia | 59.8 /100 | #165 | Average 89.3% |
| Immigrants | Albania | 59.4 /100 | #166 | Average 89.3% |
| Immigrants | Hong Kong | 58.6 /100 | #167 | Average 89.3% |