Venezuelan vs Immigrants from Northern Europe Per Capita Income
COMPARE
Venezuelan
Immigrants from Northern Europe
Per Capita Income
Per Capita Income Comparison
Venezuelans
Immigrants from Northern Europe
$42,074
PER CAPITA INCOME
14.4/ 100
METRIC RATING
207th/ 347
METRIC RANK
$54,159
PER CAPITA INCOME
100.0/ 100
METRIC RATING
21st/ 347
METRIC RANK
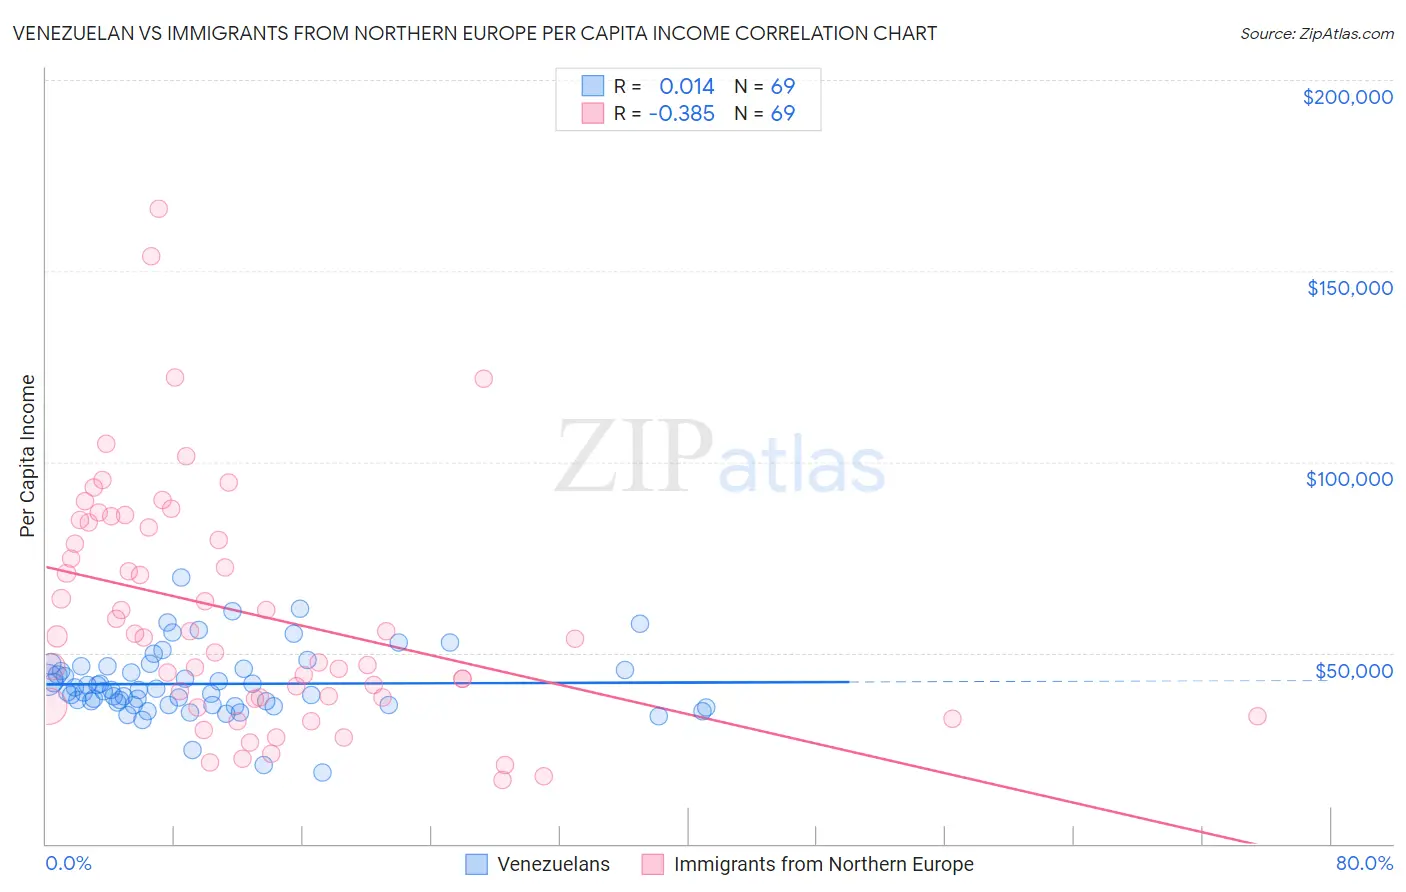
Venezuelan vs Immigrants from Northern Europe Per Capita Income Correlation Chart
The statistical analysis conducted on geographies consisting of 306,315,613 people shows no correlation between the proportion of Venezuelans and per capita income in the United States with a correlation coefficient (R) of 0.014 and weighted average of $42,074. Similarly, the statistical analysis conducted on geographies consisting of 477,262,746 people shows a mild negative correlation between the proportion of Immigrants from Northern Europe and per capita income in the United States with a correlation coefficient (R) of -0.385 and weighted average of $54,159, a difference of 28.7%.
Per Capita Income Correlation Summary
| Measurement | Venezuelan | Immigrants from Northern Europe |
| Minimum | $18,497 | $16,541 |
| Maximum | $69,728 | $166,372 |
| Range | $51,231 | $149,831 |
| Mean | $41,856 | $60,222 |
| Median | $40,215 | $53,889 |
| Interquartile 25% (IQ1) | $36,400 | $38,162 |
| Interquartile 75% (IQ3) | $46,139 | $83,485 |
| Interquartile Range (IQR) | $9,740 | $45,324 |
| Standard Deviation (Sample) | $8,927 | $31,097 |
| Standard Deviation (Population) | $8,862 | $30,871 |
Similar Demographics by Per Capita Income
Demographics Similar to Venezuelans by Per Capita Income
In terms of per capita income, the demographic groups most similar to Venezuelans are Panamanian ($42,035, a difference of 0.090%), Ghanaian ($42,164, a difference of 0.21%), Immigrants from Sudan ($41,986, a difference of 0.21%), White/Caucasian ($42,180, a difference of 0.25%), and Ecuadorian ($41,958, a difference of 0.28%).
| Demographics | Rating | Rank | Per Capita Income |
| Vietnamese | 19.0 /100 | #200 | Poor $42,368 |
| Immigrants | Thailand | 17.6 /100 | #201 | Poor $42,289 |
| Immigrants | Bosnia and Herzegovina | 17.5 /100 | #202 | Poor $42,278 |
| Spanish | 17.0 /100 | #203 | Poor $42,249 |
| Aleuts | 16.4 /100 | #204 | Poor $42,210 |
| Whites/Caucasians | 15.9 /100 | #205 | Poor $42,180 |
| Ghanaians | 15.7 /100 | #206 | Poor $42,164 |
| Venezuelans | 14.4 /100 | #207 | Poor $42,074 |
| Panamanians | 13.9 /100 | #208 | Poor $42,035 |
| Immigrants | Sudan | 13.2 /100 | #209 | Poor $41,986 |
| Ecuadorians | 12.9 /100 | #210 | Poor $41,958 |
| Immigrants | Panama | 11.6 /100 | #211 | Poor $41,853 |
| Immigrants | Senegal | 11.3 /100 | #212 | Poor $41,830 |
| Immigrants | Venezuela | 10.2 /100 | #213 | Poor $41,727 |
| Immigrants | Bangladesh | 10.1 /100 | #214 | Poor $41,709 |
Demographics Similar to Immigrants from Northern Europe by Per Capita Income
In terms of per capita income, the demographic groups most similar to Immigrants from Northern Europe are Soviet Union ($54,202, a difference of 0.080%), Immigrants from China ($54,264, a difference of 0.19%), Thai ($54,307, a difference of 0.27%), Indian (Asian) ($53,874, a difference of 0.53%), and Immigrants from Eastern Asia ($53,806, a difference of 0.66%).
| Demographics | Rating | Rank | Per Capita Income |
| Immigrants | Belgium | 100.0 /100 | #14 | Exceptional $55,082 |
| Cypriots | 100.0 /100 | #15 | Exceptional $54,899 |
| Immigrants | Switzerland | 100.0 /100 | #16 | Exceptional $54,866 |
| Immigrants | France | 100.0 /100 | #17 | Exceptional $54,557 |
| Thais | 100.0 /100 | #18 | Exceptional $54,307 |
| Immigrants | China | 100.0 /100 | #19 | Exceptional $54,264 |
| Soviet Union | 100.0 /100 | #20 | Exceptional $54,202 |
| Immigrants | Northern Europe | 100.0 /100 | #21 | Exceptional $54,159 |
| Indians (Asian) | 100.0 /100 | #22 | Exceptional $53,874 |
| Immigrants | Eastern Asia | 100.0 /100 | #23 | Exceptional $53,806 |
| Immigrants | Denmark | 100.0 /100 | #24 | Exceptional $53,799 |
| Immigrants | Japan | 100.0 /100 | #25 | Exceptional $53,359 |
| Russians | 100.0 /100 | #26 | Exceptional $53,154 |
| Immigrants | South Central Asia | 100.0 /100 | #27 | Exceptional $52,660 |
| Latvians | 100.0 /100 | #28 | Exceptional $52,649 |