Iroquois vs Immigrants from Northern Europe Per Capita Income
COMPARE
Iroquois
Immigrants from Northern Europe
Per Capita Income
Per Capita Income Comparison
Iroquois
Immigrants from Northern Europe
$39,104
PER CAPITA INCOME
0.6/ 100
METRIC RATING
262nd/ 347
METRIC RANK
$54,159
PER CAPITA INCOME
100.0/ 100
METRIC RATING
21st/ 347
METRIC RANK
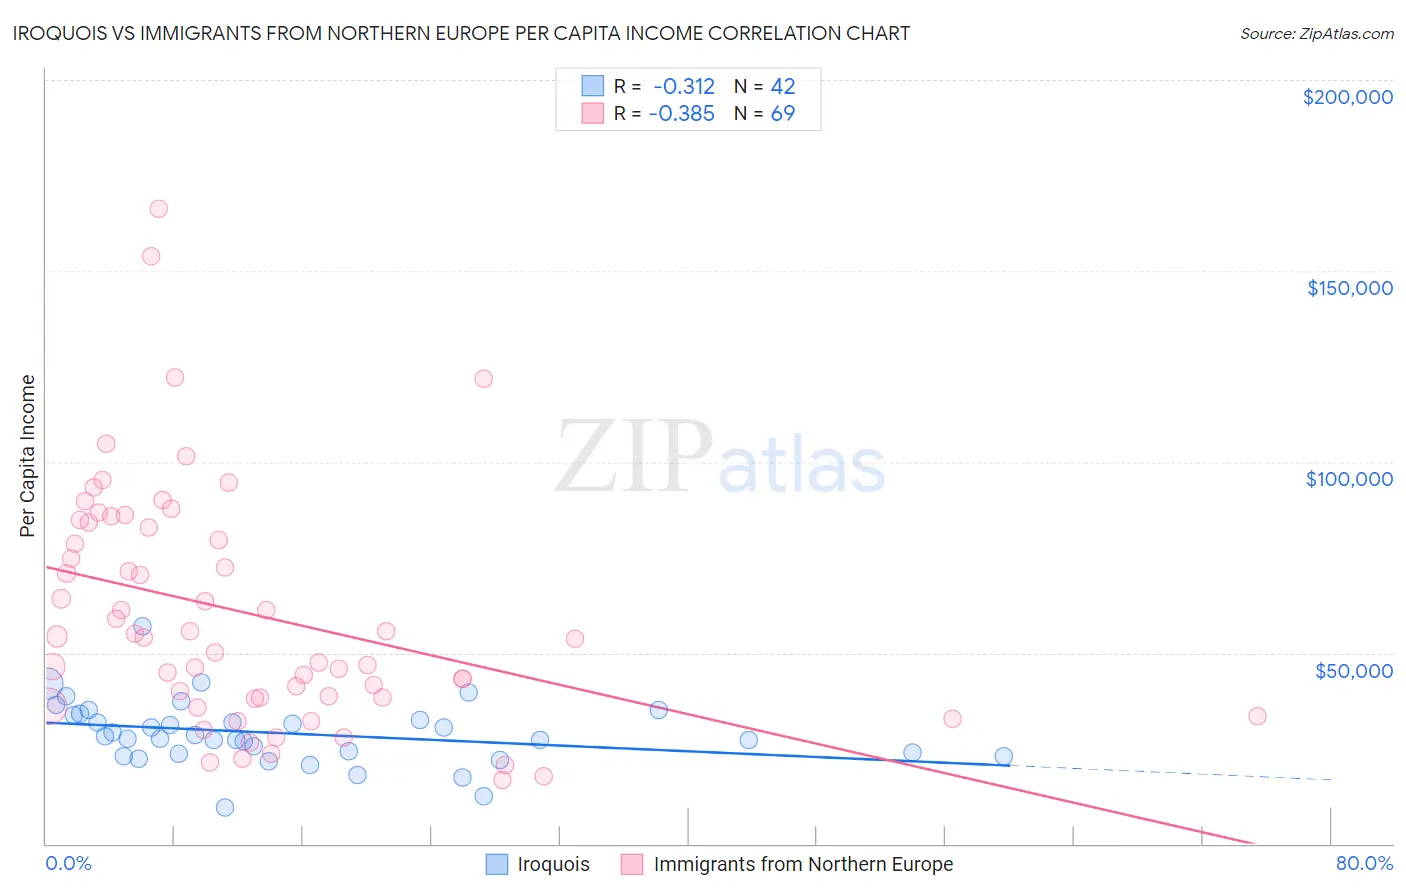
Iroquois vs Immigrants from Northern Europe Per Capita Income Correlation Chart
The statistical analysis conducted on geographies consisting of 207,308,382 people shows a mild negative correlation between the proportion of Iroquois and per capita income in the United States with a correlation coefficient (R) of -0.312 and weighted average of $39,104. Similarly, the statistical analysis conducted on geographies consisting of 477,262,746 people shows a mild negative correlation between the proportion of Immigrants from Northern Europe and per capita income in the United States with a correlation coefficient (R) of -0.385 and weighted average of $54,159, a difference of 38.5%.
Per Capita Income Correlation Summary
| Measurement | Iroquois | Immigrants from Northern Europe |
| Minimum | $9,644 | $16,541 |
| Maximum | $57,083 | $166,372 |
| Range | $47,439 | $149,831 |
| Mean | $28,880 | $60,222 |
| Median | $27,852 | $53,889 |
| Interquartile 25% (IQ1) | $23,617 | $38,162 |
| Interquartile 75% (IQ3) | $33,731 | $83,485 |
| Interquartile Range (IQR) | $10,114 | $45,324 |
| Standard Deviation (Sample) | $8,453 | $31,097 |
| Standard Deviation (Population) | $8,352 | $30,871 |
Similar Demographics by Per Capita Income
Demographics Similar to Iroquois by Per Capita Income
In terms of per capita income, the demographic groups most similar to Iroquois are Marshallese ($39,108, a difference of 0.010%), Belizean ($39,097, a difference of 0.020%), Alaskan Athabascan ($39,163, a difference of 0.15%), American ($39,039, a difference of 0.16%), and Malaysian ($39,194, a difference of 0.23%).
| Demographics | Rating | Rank | Per Capita Income |
| Immigrants | Middle Africa | 1.0 /100 | #255 | Tragic $39,529 |
| Hawaiians | 0.8 /100 | #256 | Tragic $39,403 |
| Nicaraguans | 0.8 /100 | #257 | Tragic $39,372 |
| Jamaicans | 0.7 /100 | #258 | Tragic $39,231 |
| Malaysians | 0.7 /100 | #259 | Tragic $39,194 |
| Alaskan Athabascans | 0.6 /100 | #260 | Tragic $39,163 |
| Marshallese | 0.6 /100 | #261 | Tragic $39,108 |
| Iroquois | 0.6 /100 | #262 | Tragic $39,104 |
| Belizeans | 0.6 /100 | #263 | Tragic $39,097 |
| Americans | 0.6 /100 | #264 | Tragic $39,039 |
| Spanish Americans | 0.5 /100 | #265 | Tragic $39,012 |
| Salvadorans | 0.5 /100 | #266 | Tragic $38,858 |
| Immigrants | Zaire | 0.4 /100 | #267 | Tragic $38,848 |
| Liberians | 0.4 /100 | #268 | Tragic $38,780 |
| Immigrants | Jamaica | 0.4 /100 | #269 | Tragic $38,766 |
Demographics Similar to Immigrants from Northern Europe by Per Capita Income
In terms of per capita income, the demographic groups most similar to Immigrants from Northern Europe are Soviet Union ($54,202, a difference of 0.080%), Immigrants from China ($54,264, a difference of 0.19%), Thai ($54,307, a difference of 0.27%), Indian (Asian) ($53,874, a difference of 0.53%), and Immigrants from Eastern Asia ($53,806, a difference of 0.66%).
| Demographics | Rating | Rank | Per Capita Income |
| Immigrants | Belgium | 100.0 /100 | #14 | Exceptional $55,082 |
| Cypriots | 100.0 /100 | #15 | Exceptional $54,899 |
| Immigrants | Switzerland | 100.0 /100 | #16 | Exceptional $54,866 |
| Immigrants | France | 100.0 /100 | #17 | Exceptional $54,557 |
| Thais | 100.0 /100 | #18 | Exceptional $54,307 |
| Immigrants | China | 100.0 /100 | #19 | Exceptional $54,264 |
| Soviet Union | 100.0 /100 | #20 | Exceptional $54,202 |
| Immigrants | Northern Europe | 100.0 /100 | #21 | Exceptional $54,159 |
| Indians (Asian) | 100.0 /100 | #22 | Exceptional $53,874 |
| Immigrants | Eastern Asia | 100.0 /100 | #23 | Exceptional $53,806 |
| Immigrants | Denmark | 100.0 /100 | #24 | Exceptional $53,799 |
| Immigrants | Japan | 100.0 /100 | #25 | Exceptional $53,359 |
| Russians | 100.0 /100 | #26 | Exceptional $53,154 |
| Immigrants | South Central Asia | 100.0 /100 | #27 | Exceptional $52,660 |
| Latvians | 100.0 /100 | #28 | Exceptional $52,649 |