Comanche vs Zimbabwean Median Male Earnings
COMPARE
Comanche
Zimbabwean
Median Male Earnings
Median Male Earnings Comparison
Comanche
Zimbabweans
$48,202
MEDIAN MALE EARNINGS
0.2/ 100
METRIC RATING
280th/ 347
METRIC RANK
$56,302
MEDIAN MALE EARNINGS
85.5/ 100
METRIC RATING
139th/ 347
METRIC RANK
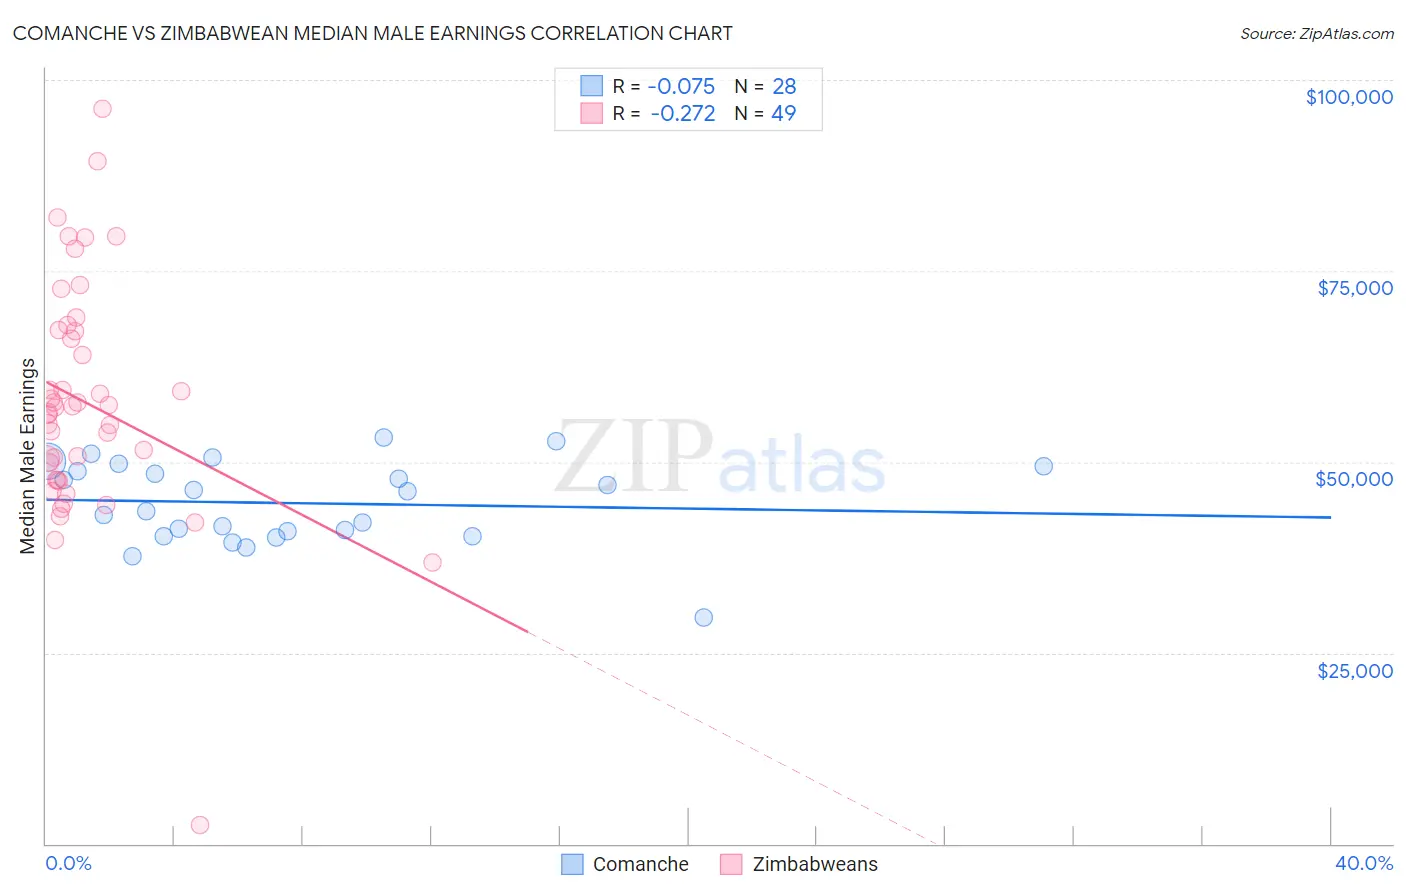
Comanche vs Zimbabwean Median Male Earnings Correlation Chart
The statistical analysis conducted on geographies consisting of 109,761,350 people shows a slight negative correlation between the proportion of Comanche and median male earnings in the United States with a correlation coefficient (R) of -0.075 and weighted average of $48,202. Similarly, the statistical analysis conducted on geographies consisting of 69,206,147 people shows a weak negative correlation between the proportion of Zimbabweans and median male earnings in the United States with a correlation coefficient (R) of -0.272 and weighted average of $56,302, a difference of 16.8%.
Median Male Earnings Correlation Summary
| Measurement | Comanche | Zimbabwean |
| Minimum | $29,698 | $2,499 |
| Maximum | $53,182 | $96,250 |
| Range | $23,484 | $93,751 |
| Mean | $44,594 | $57,721 |
| Median | $44,855 | $57,093 |
| Interquartile 25% (IQ1) | $40,605 | $47,581 |
| Interquartile 75% (IQ3) | $49,111 | $67,190 |
| Interquartile Range (IQR) | $8,506 | $19,609 |
| Standard Deviation (Sample) | $5,459 | $15,546 |
| Standard Deviation (Population) | $5,361 | $15,387 |
Similar Demographics by Median Male Earnings
Demographics Similar to Comanche by Median Male Earnings
In terms of median male earnings, the demographic groups most similar to Comanche are Hmong ($48,254, a difference of 0.11%), Marshallese ($48,137, a difference of 0.13%), Central American ($48,093, a difference of 0.23%), Immigrants from Liberia ($48,317, a difference of 0.24%), and Belizean ($48,358, a difference of 0.32%).
| Demographics | Rating | Rank | Median Male Earnings |
| Jamaicans | 0.3 /100 | #273 | Tragic $48,632 |
| Colville | 0.3 /100 | #274 | Tragic $48,516 |
| Immigrants | Somalia | 0.3 /100 | #275 | Tragic $48,439 |
| Blackfeet | 0.3 /100 | #276 | Tragic $48,402 |
| Belizeans | 0.2 /100 | #277 | Tragic $48,358 |
| Immigrants | Liberia | 0.2 /100 | #278 | Tragic $48,317 |
| Hmong | 0.2 /100 | #279 | Tragic $48,254 |
| Comanche | 0.2 /100 | #280 | Tragic $48,202 |
| Marshallese | 0.2 /100 | #281 | Tragic $48,137 |
| Central Americans | 0.2 /100 | #282 | Tragic $48,093 |
| Immigrants | Jamaica | 0.2 /100 | #283 | Tragic $48,040 |
| Africans | 0.2 /100 | #284 | Tragic $47,994 |
| Paiute | 0.2 /100 | #285 | Tragic $47,991 |
| Mexican American Indians | 0.2 /100 | #286 | Tragic $47,990 |
| Immigrants | El Salvador | 0.2 /100 | #287 | Tragic $47,973 |
Demographics Similar to Zimbabweans by Median Male Earnings
In terms of median male earnings, the demographic groups most similar to Zimbabweans are Luxembourger ($56,300, a difference of 0.0%), Slovak ($56,306, a difference of 0.010%), Danish ($56,246, a difference of 0.10%), Ethiopian ($56,243, a difference of 0.10%), and Slavic ($56,390, a difference of 0.16%).
| Demographics | Rating | Rank | Median Male Earnings |
| Czechs | 88.2 /100 | #132 | Excellent $56,546 |
| Immigrants | Germany | 88.2 /100 | #133 | Excellent $56,542 |
| Moroccans | 87.7 /100 | #134 | Excellent $56,499 |
| Irish | 87.4 /100 | #135 | Excellent $56,464 |
| Immigrants | Saudi Arabia | 87.2 /100 | #136 | Excellent $56,452 |
| Slavs | 86.5 /100 | #137 | Excellent $56,390 |
| Slovaks | 85.5 /100 | #138 | Excellent $56,306 |
| Zimbabweans | 85.5 /100 | #139 | Excellent $56,302 |
| Luxembourgers | 85.5 /100 | #140 | Excellent $56,300 |
| Danes | 84.8 /100 | #141 | Excellent $56,246 |
| Ethiopians | 84.8 /100 | #142 | Excellent $56,243 |
| Sri Lankans | 83.4 /100 | #143 | Excellent $56,136 |
| Immigrants | Uganda | 82.4 /100 | #144 | Excellent $56,064 |
| Norwegians | 80.9 /100 | #145 | Excellent $55,965 |
| Immigrants | Chile | 80.7 /100 | #146 | Excellent $55,954 |