Russian vs Zimbabwean Householder Income Under 25 years
COMPARE
Russian
Zimbabwean
Householder Income Under 25 years
Householder Income Under 25 years Comparison
Russians
Zimbabweans
$54,389
HOUSEHOLDER INCOME UNDER 25 YEARS
99.5/ 100
METRIC RATING
82nd/ 347
METRIC RANK
$51,259
HOUSEHOLDER INCOME UNDER 25 YEARS
9.3/ 100
METRIC RATING
214th/ 347
METRIC RANK
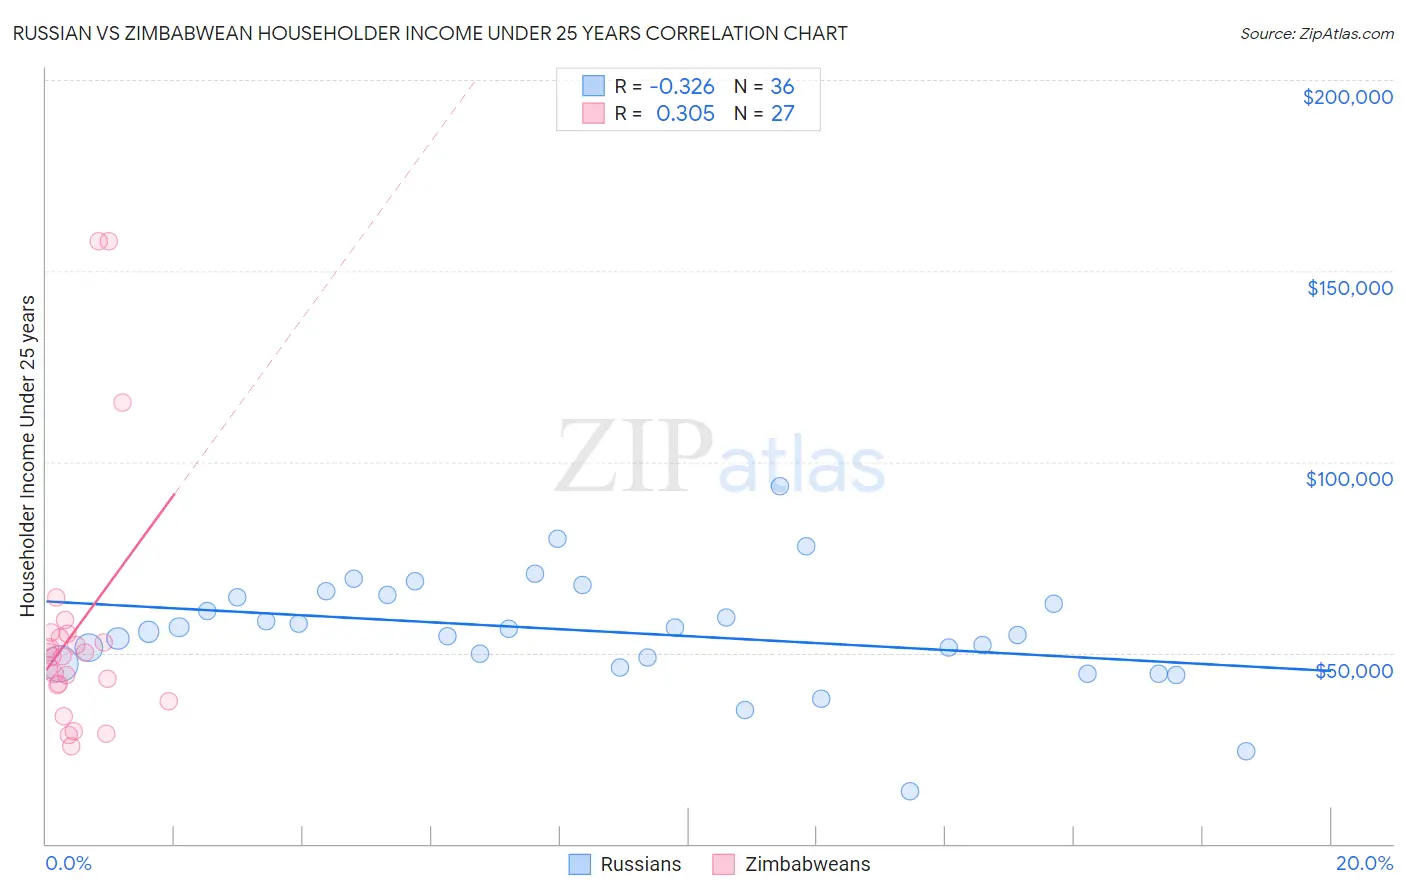
Russian vs Zimbabwean Householder Income Under 25 years Correlation Chart
The statistical analysis conducted on geographies consisting of 408,933,580 people shows a mild negative correlation between the proportion of Russians and household income with householder under the age of 25 in the United States with a correlation coefficient (R) of -0.326 and weighted average of $54,389. Similarly, the statistical analysis conducted on geographies consisting of 66,344,715 people shows a mild positive correlation between the proportion of Zimbabweans and household income with householder under the age of 25 in the United States with a correlation coefficient (R) of 0.305 and weighted average of $51,259, a difference of 6.1%.
Householder Income Under 25 years Correlation Summary
| Measurement | Russian | Zimbabwean |
| Minimum | $13,906 | $25,388 |
| Maximum | $93,571 | $157,810 |
| Range | $79,665 | $132,422 |
| Mean | $55,615 | $56,178 |
| Median | $55,875 | $48,971 |
| Interquartile 25% (IQ1) | $48,025 | $41,511 |
| Interquartile 75% (IQ3) | $64,893 | $55,000 |
| Interquartile Range (IQR) | $16,868 | $13,489 |
| Standard Deviation (Sample) | $14,911 | $33,671 |
| Standard Deviation (Population) | $14,703 | $33,042 |
Similar Demographics by Householder Income Under 25 years
Demographics Similar to Russians by Householder Income Under 25 years
In terms of householder income under 25 years, the demographic groups most similar to Russians are Laotian ($54,369, a difference of 0.040%), Bulgarian ($54,352, a difference of 0.070%), Immigrants from Czechoslovakia ($54,352, a difference of 0.070%), Portuguese ($54,436, a difference of 0.090%), and Immigrants from Croatia ($54,343, a difference of 0.090%).
| Demographics | Rating | Rank | Householder Income Under 25 years |
| Immigrants | Sri Lanka | 99.7 /100 | #75 | Exceptional $54,512 |
| Immigrants | Brazil | 99.6 /100 | #76 | Exceptional $54,487 |
| Immigrants | Southern Europe | 99.6 /100 | #77 | Exceptional $54,484 |
| Nepalese | 99.6 /100 | #78 | Exceptional $54,472 |
| Immigrants | Italy | 99.6 /100 | #79 | Exceptional $54,449 |
| Egyptians | 99.6 /100 | #80 | Exceptional $54,444 |
| Portuguese | 99.6 /100 | #81 | Exceptional $54,436 |
| Russians | 99.5 /100 | #82 | Exceptional $54,389 |
| Laotians | 99.5 /100 | #83 | Exceptional $54,369 |
| Bulgarians | 99.5 /100 | #84 | Exceptional $54,352 |
| Immigrants | Czechoslovakia | 99.5 /100 | #85 | Exceptional $54,352 |
| Immigrants | Croatia | 99.5 /100 | #86 | Exceptional $54,343 |
| Brazilians | 99.5 /100 | #87 | Exceptional $54,335 |
| Yakama | 99.5 /100 | #88 | Exceptional $54,321 |
| Immigrants | South America | 99.4 /100 | #89 | Exceptional $54,268 |
Demographics Similar to Zimbabweans by Householder Income Under 25 years
In terms of householder income under 25 years, the demographic groups most similar to Zimbabweans are Dutch ($51,265, a difference of 0.010%), Icelander ($51,247, a difference of 0.020%), Immigrants from Panama ($51,278, a difference of 0.040%), French ($51,230, a difference of 0.060%), and Czechoslovakian ($51,224, a difference of 0.070%).
| Demographics | Rating | Rank | Householder Income Under 25 years |
| South Africans | 12.2 /100 | #207 | Poor $51,383 |
| Immigrants | Jordan | 11.9 /100 | #208 | Poor $51,370 |
| Syrians | 11.4 /100 | #209 | Poor $51,353 |
| Immigrants | Ghana | 10.9 /100 | #210 | Poor $51,333 |
| Irish | 10.6 /100 | #211 | Poor $51,317 |
| Immigrants | Panama | 9.7 /100 | #212 | Tragic $51,278 |
| Dutch | 9.4 /100 | #213 | Tragic $51,265 |
| Zimbabweans | 9.3 /100 | #214 | Tragic $51,259 |
| Icelanders | 9.1 /100 | #215 | Tragic $51,247 |
| French | 8.7 /100 | #216 | Tragic $51,230 |
| Czechoslovakians | 8.6 /100 | #217 | Tragic $51,224 |
| Immigrants | Belize | 8.6 /100 | #218 | Tragic $51,223 |
| Arabs | 8.5 /100 | #219 | Tragic $51,219 |
| Immigrants | Germany | 8.0 /100 | #220 | Tragic $51,190 |
| Immigrants | Eastern Africa | 7.4 /100 | #221 | Tragic $51,158 |