Immigrants from Ireland vs Immigrants from Honduras Householder Income Ages 25 - 44 years
COMPARE
Immigrants from Ireland
Immigrants from Honduras
Householder Income Ages 25 - 44 years
Householder Income Ages 25 - 44 years Comparison
Immigrants from Ireland
Immigrants from Honduras
$120,333
HOUSEHOLDER INCOME AGES 25 - 44 YEARS
100.0/ 100
METRIC RATING
7th/ 347
METRIC RANK
$77,328
HOUSEHOLDER INCOME AGES 25 - 44 YEARS
0.0/ 100
METRIC RATING
323rd/ 347
METRIC RANK
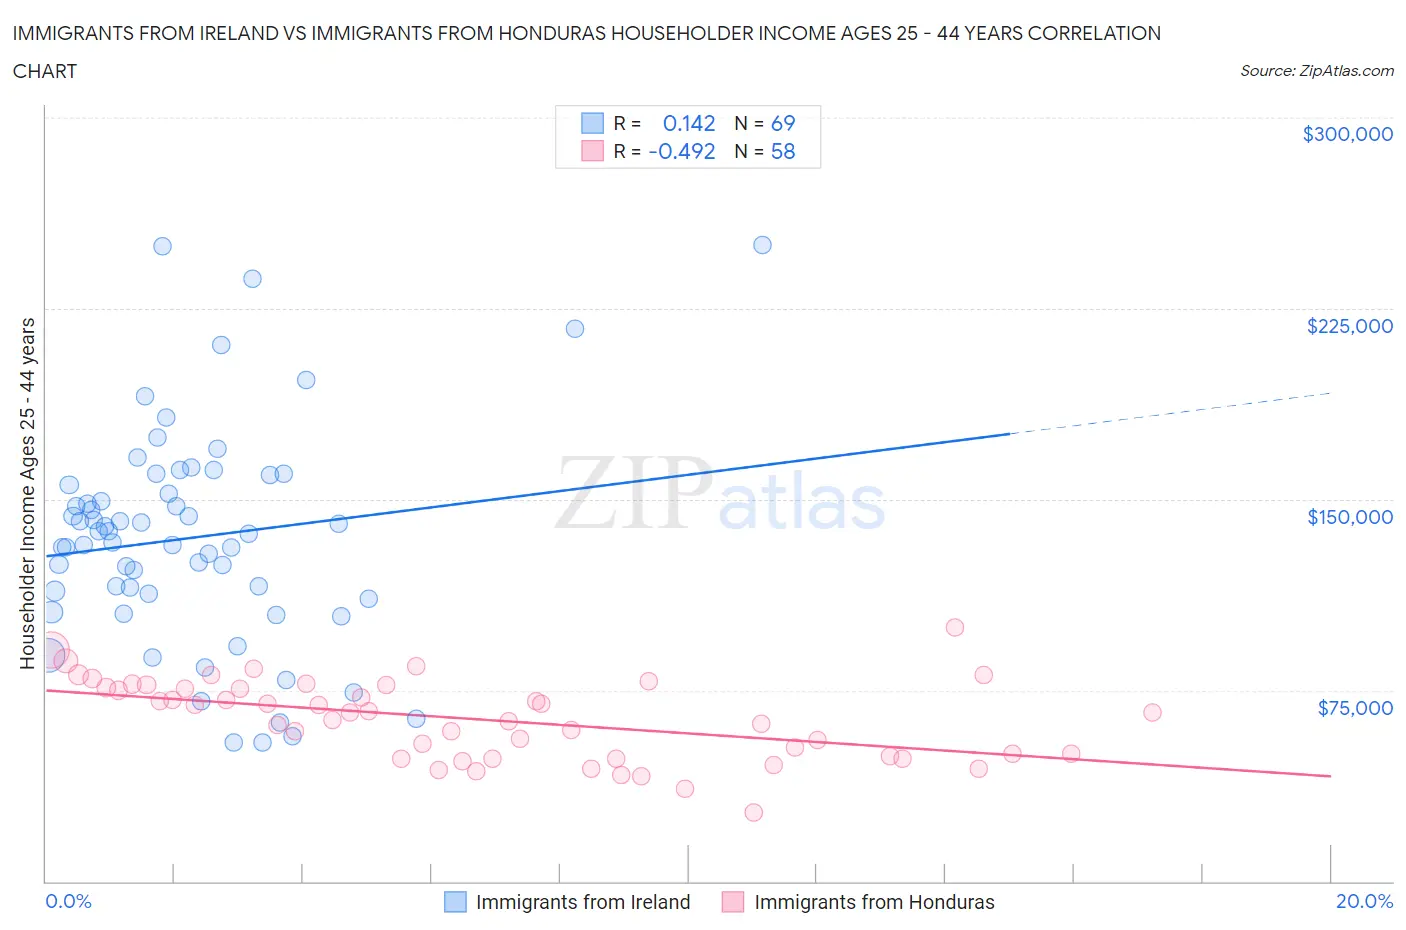
Immigrants from Ireland vs Immigrants from Honduras Householder Income Ages 25 - 44 years Correlation Chart
The statistical analysis conducted on geographies consisting of 240,342,740 people shows a poor positive correlation between the proportion of Immigrants from Ireland and household income with householder between the ages 25 and 44 in the United States with a correlation coefficient (R) of 0.142 and weighted average of $120,333. Similarly, the statistical analysis conducted on geographies consisting of 321,952,844 people shows a moderate negative correlation between the proportion of Immigrants from Honduras and household income with householder between the ages 25 and 44 in the United States with a correlation coefficient (R) of -0.492 and weighted average of $77,328, a difference of 55.6%.
Householder Income Ages 25 - 44 years Correlation Summary
| Measurement | Immigrants from Ireland | Immigrants from Honduras |
| Minimum | $54,479 | $26,956 |
| Maximum | $250,001 | $99,657 |
| Range | $195,522 | $72,701 |
| Mean | $134,959 | $63,676 |
| Median | $136,656 | $66,366 |
| Interquartile 25% (IQ1) | $112,137 | $49,234 |
| Interquartile 75% (IQ3) | $157,677 | $76,183 |
| Interquartile Range (IQR) | $45,540 | $26,949 |
| Standard Deviation (Sample) | $42,676 | $15,519 |
| Standard Deviation (Population) | $42,366 | $15,385 |
Similar Demographics by Householder Income Ages 25 - 44 years
Demographics Similar to Immigrants from Ireland by Householder Income Ages 25 - 44 years
In terms of householder income ages 25 - 44 years, the demographic groups most similar to Immigrants from Ireland are Iranian ($120,292, a difference of 0.030%), Immigrants from China ($119,756, a difference of 0.48%), Indian (Asian) ($119,496, a difference of 0.70%), Okinawan ($119,349, a difference of 0.82%), and Immigrants from Iran ($119,204, a difference of 0.95%).
| Demographics | Rating | Rank | Householder Income Ages 25 - 44 years |
| Immigrants | Taiwan | 100.0 /100 | #1 | Exceptional $129,122 |
| Filipinos | 100.0 /100 | #2 | Exceptional $128,723 |
| Immigrants | Hong Kong | 100.0 /100 | #3 | Exceptional $128,140 |
| Immigrants | Singapore | 100.0 /100 | #4 | Exceptional $124,429 |
| Immigrants | India | 100.0 /100 | #5 | Exceptional $124,238 |
| Thais | 100.0 /100 | #6 | Exceptional $121,778 |
| Immigrants | Ireland | 100.0 /100 | #7 | Exceptional $120,333 |
| Iranians | 100.0 /100 | #8 | Exceptional $120,292 |
| Immigrants | China | 100.0 /100 | #9 | Exceptional $119,756 |
| Indians (Asian) | 100.0 /100 | #10 | Exceptional $119,496 |
| Okinawans | 100.0 /100 | #11 | Exceptional $119,349 |
| Immigrants | Iran | 100.0 /100 | #12 | Exceptional $119,204 |
| Immigrants | Eastern Asia | 100.0 /100 | #13 | Exceptional $118,056 |
| Immigrants | Israel | 100.0 /100 | #14 | Exceptional $117,219 |
| Immigrants | South Central Asia | 100.0 /100 | #15 | Exceptional $116,626 |
Demographics Similar to Immigrants from Honduras by Householder Income Ages 25 - 44 years
In terms of householder income ages 25 - 44 years, the demographic groups most similar to Immigrants from Honduras are Dutch West Indian ($77,260, a difference of 0.090%), Sioux ($77,089, a difference of 0.31%), Houma ($77,044, a difference of 0.37%), Immigrants from Bahamas ($76,910, a difference of 0.54%), and Chickasaw ($77,929, a difference of 0.78%).
| Demographics | Rating | Rank | Householder Income Ages 25 - 44 years |
| Africans | 0.0 /100 | #316 | Tragic $78,986 |
| U.S. Virgin Islanders | 0.0 /100 | #317 | Tragic $78,911 |
| Immigrants | Mexico | 0.0 /100 | #318 | Tragic $78,809 |
| Hondurans | 0.0 /100 | #319 | Tragic $78,540 |
| Choctaw | 0.0 /100 | #320 | Tragic $78,168 |
| Immigrants | Zaire | 0.0 /100 | #321 | Tragic $78,045 |
| Chickasaw | 0.0 /100 | #322 | Tragic $77,929 |
| Immigrants | Honduras | 0.0 /100 | #323 | Tragic $77,328 |
| Dutch West Indians | 0.0 /100 | #324 | Tragic $77,260 |
| Sioux | 0.0 /100 | #325 | Tragic $77,089 |
| Houma | 0.0 /100 | #326 | Tragic $77,044 |
| Immigrants | Bahamas | 0.0 /100 | #327 | Tragic $76,910 |
| Immigrants | Cuba | 0.0 /100 | #328 | Tragic $76,701 |
| Seminole | 0.0 /100 | #329 | Tragic $76,584 |
| Yakama | 0.0 /100 | #330 | Tragic $76,226 |