Immigrants from Switzerland vs Immigrants from South Africa Median Household Income
COMPARE
Immigrants from Switzerland
Immigrants from South Africa
Median Household Income
Median Household Income Comparison
Immigrants from Switzerland
Immigrants from South Africa
$97,979
MEDIAN HOUSEHOLD INCOME
100.0/ 100
METRIC RATING
35th/ 347
METRIC RANK
$95,800
MEDIAN HOUSEHOLD INCOME
99.9/ 100
METRIC RATING
52nd/ 347
METRIC RANK
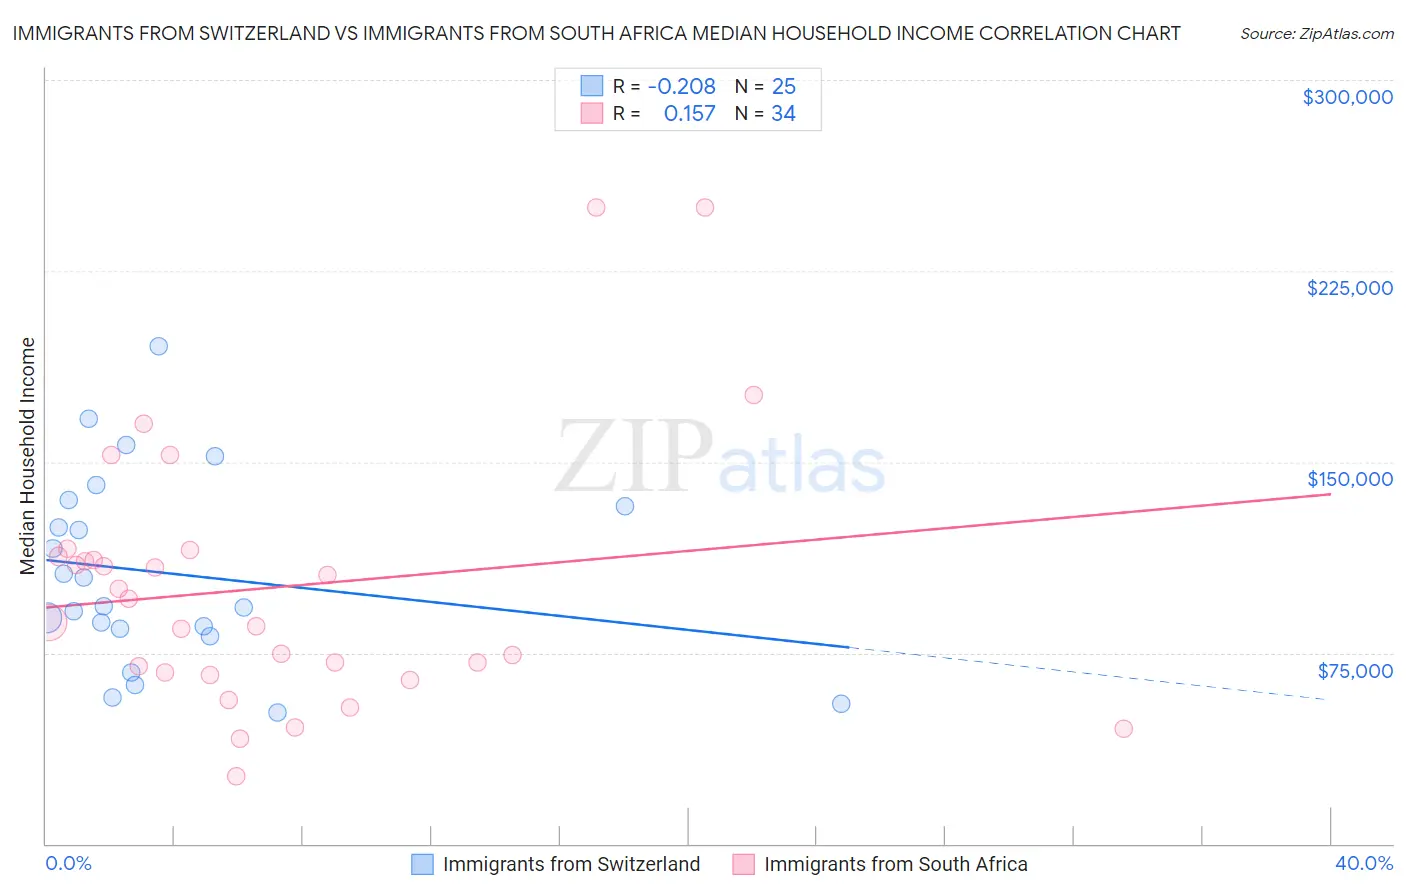
Immigrants from Switzerland vs Immigrants from South Africa Median Household Income Correlation Chart
The statistical analysis conducted on geographies consisting of 148,056,974 people shows a weak negative correlation between the proportion of Immigrants from Switzerland and median household income in the United States with a correlation coefficient (R) of -0.208 and weighted average of $97,979. Similarly, the statistical analysis conducted on geographies consisting of 233,255,435 people shows a poor positive correlation between the proportion of Immigrants from South Africa and median household income in the United States with a correlation coefficient (R) of 0.157 and weighted average of $95,800, a difference of 2.3%.
Median Household Income Correlation Summary
| Measurement | Immigrants from Switzerland | Immigrants from South Africa |
| Minimum | $51,573 | $26,321 |
| Maximum | $195,586 | $250,001 |
| Range | $144,013 | $223,680 |
| Mean | $106,072 | $100,741 |
| Median | $93,190 | $91,620 |
| Interquartile 25% (IQ1) | $82,852 | $67,153 |
| Interquartile 75% (IQ3) | $133,796 | $112,945 |
| Interquartile Range (IQR) | $50,943 | $45,792 |
| Standard Deviation (Sample) | $37,589 | $51,810 |
| Standard Deviation (Population) | $36,829 | $51,042 |
Demographics Similar to Immigrants from Switzerland and Immigrants from South Africa by Median Household Income
In terms of median household income, the demographic groups most similar to Immigrants from Switzerland are Russian ($98,008, a difference of 0.030%), Immigrants from Pakistan ($97,528, a difference of 0.46%), Chinese ($98,496, a difference of 0.53%), Latvian ($97,311, a difference of 0.69%), and Immigrants from Indonesia ($97,297, a difference of 0.70%). Similarly, the demographic groups most similar to Immigrants from South Africa are Paraguayan ($95,737, a difference of 0.070%), Estonian ($95,930, a difference of 0.14%), Immigrants from Malaysia ($96,292, a difference of 0.51%), Bulgarian ($96,290, a difference of 0.51%), and Cambodian ($96,324, a difference of 0.55%).
| Demographics | Rating | Rank | Median Household Income |
| Chinese | 100.0 /100 | #33 | Exceptional $98,496 |
| Russians | 100.0 /100 | #34 | Exceptional $98,008 |
| Immigrants | Switzerland | 100.0 /100 | #35 | Exceptional $97,979 |
| Immigrants | Pakistan | 100.0 /100 | #36 | Exceptional $97,528 |
| Latvians | 100.0 /100 | #37 | Exceptional $97,311 |
| Immigrants | Indonesia | 100.0 /100 | #38 | Exceptional $97,297 |
| Afghans | 100.0 /100 | #39 | Exceptional $97,026 |
| Maltese | 100.0 /100 | #40 | Exceptional $97,015 |
| Immigrants | Turkey | 100.0 /100 | #41 | Exceptional $96,964 |
| Immigrants | Lithuania | 99.9 /100 | #42 | Exceptional $96,836 |
| Immigrants | France | 99.9 /100 | #43 | Exceptional $96,743 |
| Immigrants | Greece | 99.9 /100 | #44 | Exceptional $96,675 |
| Israelis | 99.9 /100 | #45 | Exceptional $96,552 |
| Australians | 99.9 /100 | #46 | Exceptional $96,490 |
| Immigrants | Russia | 99.9 /100 | #47 | Exceptional $96,378 |
| Cambodians | 99.9 /100 | #48 | Exceptional $96,324 |
| Immigrants | Malaysia | 99.9 /100 | #49 | Exceptional $96,292 |
| Bulgarians | 99.9 /100 | #50 | Exceptional $96,290 |
| Estonians | 99.9 /100 | #51 | Exceptional $95,930 |
| Immigrants | South Africa | 99.9 /100 | #52 | Exceptional $95,800 |
| Paraguayans | 99.9 /100 | #53 | Exceptional $95,737 |