Romanian vs Tlingit-Haida Median Female Earnings
COMPARE
Romanian
Tlingit-Haida
Median Female Earnings
Median Female Earnings Comparison
Romanians
Tlingit-Haida
$41,663
MEDIAN FEMALE EARNINGS
98.3/ 100
METRIC RATING
100th/ 347
METRIC RANK
$39,513
MEDIAN FEMALE EARNINGS
40.5/ 100
METRIC RATING
182nd/ 347
METRIC RANK
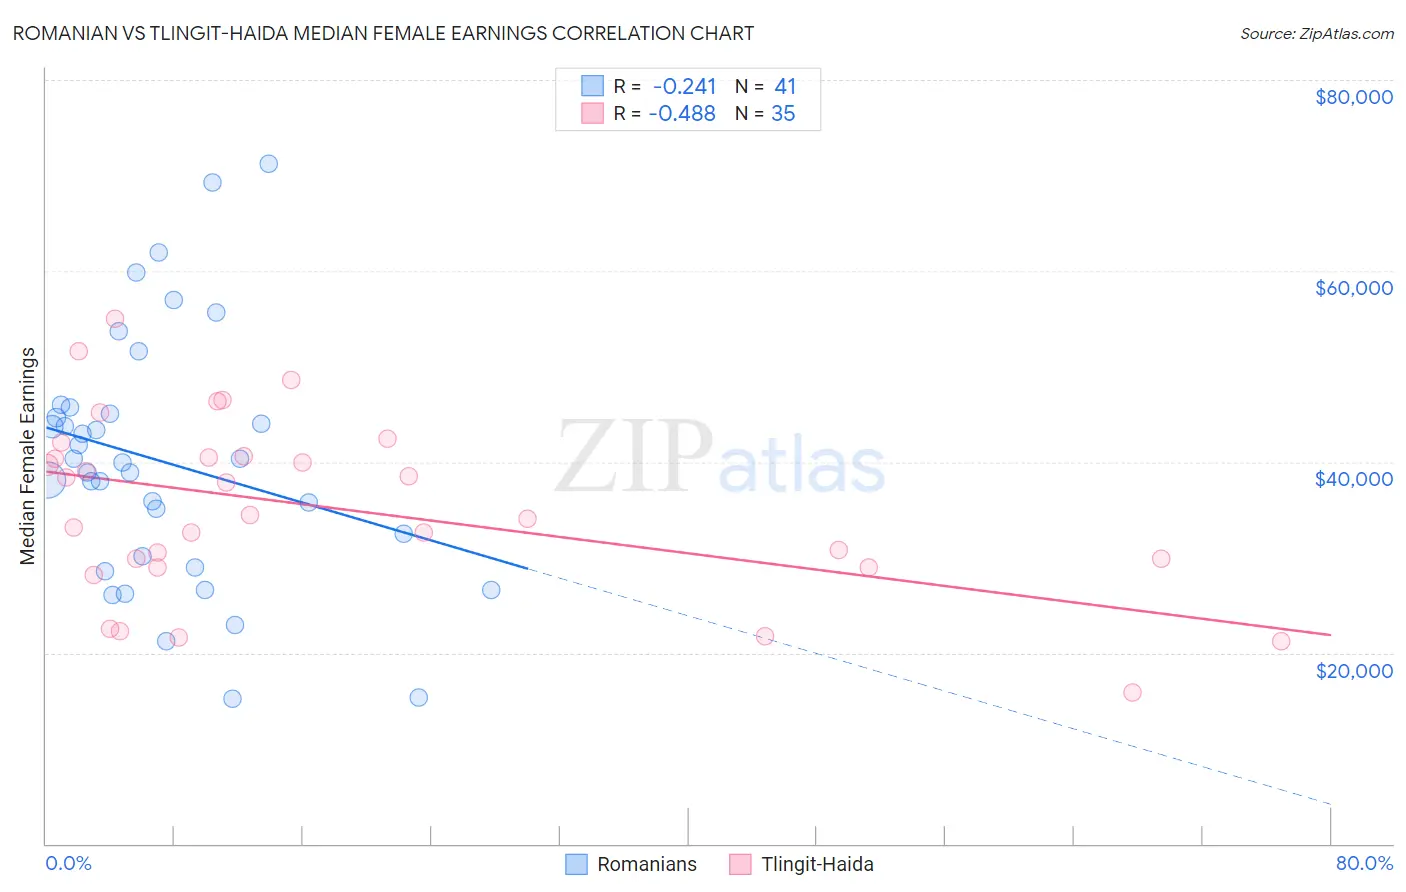
Romanian vs Tlingit-Haida Median Female Earnings Correlation Chart
The statistical analysis conducted on geographies consisting of 377,764,686 people shows a weak negative correlation between the proportion of Romanians and median female earnings in the United States with a correlation coefficient (R) of -0.241 and weighted average of $41,663. Similarly, the statistical analysis conducted on geographies consisting of 60,850,593 people shows a moderate negative correlation between the proportion of Tlingit-Haida and median female earnings in the United States with a correlation coefficient (R) of -0.488 and weighted average of $39,513, a difference of 5.4%.
Median Female Earnings Correlation Summary
| Measurement | Romanian | Tlingit-Haida |
| Minimum | $15,248 | $15,833 |
| Maximum | $71,250 | $55,000 |
| Range | $56,002 | $39,167 |
| Mean | $39,999 | $35,190 |
| Median | $39,890 | $34,397 |
| Interquartile 25% (IQ1) | $29,536 | $28,977 |
| Interquartile 75% (IQ3) | $45,366 | $40,590 |
| Interquartile Range (IQR) | $15,830 | $11,613 |
| Standard Deviation (Sample) | $13,074 | $9,336 |
| Standard Deviation (Population) | $12,914 | $9,202 |
Similar Demographics by Median Female Earnings
Demographics Similar to Romanians by Median Female Earnings
In terms of median female earnings, the demographic groups most similar to Romanians are Immigrants from Fiji ($41,656, a difference of 0.020%), Immigrants from Barbados ($41,685, a difference of 0.050%), Immigrants from Poland ($41,630, a difference of 0.080%), Immigrants from Scotland ($41,771, a difference of 0.26%), and Immigrants from Argentina ($41,554, a difference of 0.26%).
| Demographics | Rating | Rank | Median Female Earnings |
| Immigrants | Grenada | 99.0 /100 | #93 | Exceptional $41,932 |
| Moroccans | 98.9 /100 | #94 | Exceptional $41,872 |
| Immigrants | Netherlands | 98.9 /100 | #95 | Exceptional $41,870 |
| South Africans | 98.8 /100 | #96 | Exceptional $41,825 |
| Immigrants | Hungary | 98.8 /100 | #97 | Exceptional $41,820 |
| Immigrants | Scotland | 98.7 /100 | #98 | Exceptional $41,771 |
| Immigrants | Barbados | 98.4 /100 | #99 | Exceptional $41,685 |
| Romanians | 98.3 /100 | #100 | Exceptional $41,663 |
| Immigrants | Fiji | 98.3 /100 | #101 | Exceptional $41,656 |
| Immigrants | Poland | 98.2 /100 | #102 | Exceptional $41,630 |
| Immigrants | Argentina | 97.9 /100 | #103 | Exceptional $41,554 |
| Immigrants | Zimbabwe | 97.8 /100 | #104 | Exceptional $41,527 |
| Italians | 97.7 /100 | #105 | Exceptional $41,505 |
| Immigrants | Eritrea | 97.6 /100 | #106 | Exceptional $41,485 |
| Palestinians | 97.6 /100 | #107 | Exceptional $41,484 |
Demographics Similar to Tlingit-Haida by Median Female Earnings
In terms of median female earnings, the demographic groups most similar to Tlingit-Haida are Hungarian ($39,510, a difference of 0.010%), Tsimshian ($39,530, a difference of 0.050%), Immigrants from Kenya ($39,535, a difference of 0.060%), European ($39,457, a difference of 0.14%), and Immigrants from West Indies ($39,441, a difference of 0.18%).
| Demographics | Rating | Rank | Median Female Earnings |
| Immigrants | South America | 47.2 /100 | #175 | Average $39,643 |
| Nigerians | 47.0 /100 | #176 | Average $39,641 |
| Costa Ricans | 46.1 /100 | #177 | Average $39,622 |
| Slavs | 45.6 /100 | #178 | Average $39,613 |
| Immigrants | Germany | 45.1 /100 | #179 | Average $39,603 |
| Immigrants | Kenya | 41.6 /100 | #180 | Average $39,535 |
| Tsimshian | 41.4 /100 | #181 | Average $39,530 |
| Tlingit-Haida | 40.5 /100 | #182 | Average $39,513 |
| Hungarians | 40.3 /100 | #183 | Average $39,510 |
| Europeans | 37.7 /100 | #184 | Fair $39,457 |
| Immigrants | West Indies | 36.9 /100 | #185 | Fair $39,441 |
| Colombians | 36.9 /100 | #186 | Fair $39,439 |
| Swedes | 36.0 /100 | #187 | Fair $39,421 |
| Bermudans | 35.9 /100 | #188 | Fair $39,418 |
| Senegalese | 34.2 /100 | #189 | Fair $39,384 |