Romanian vs Choctaw Householder Income Over 65 years
COMPARE
Romanian
Choctaw
Householder Income Over 65 years
Householder Income Over 65 years Comparison
Romanians
Choctaw
$64,142
HOUSEHOLDER INCOME OVER 65 YEARS
96.5/ 100
METRIC RATING
98th/ 347
METRIC RANK
$53,060
HOUSEHOLDER INCOME OVER 65 YEARS
0.0/ 100
METRIC RATING
303rd/ 347
METRIC RANK
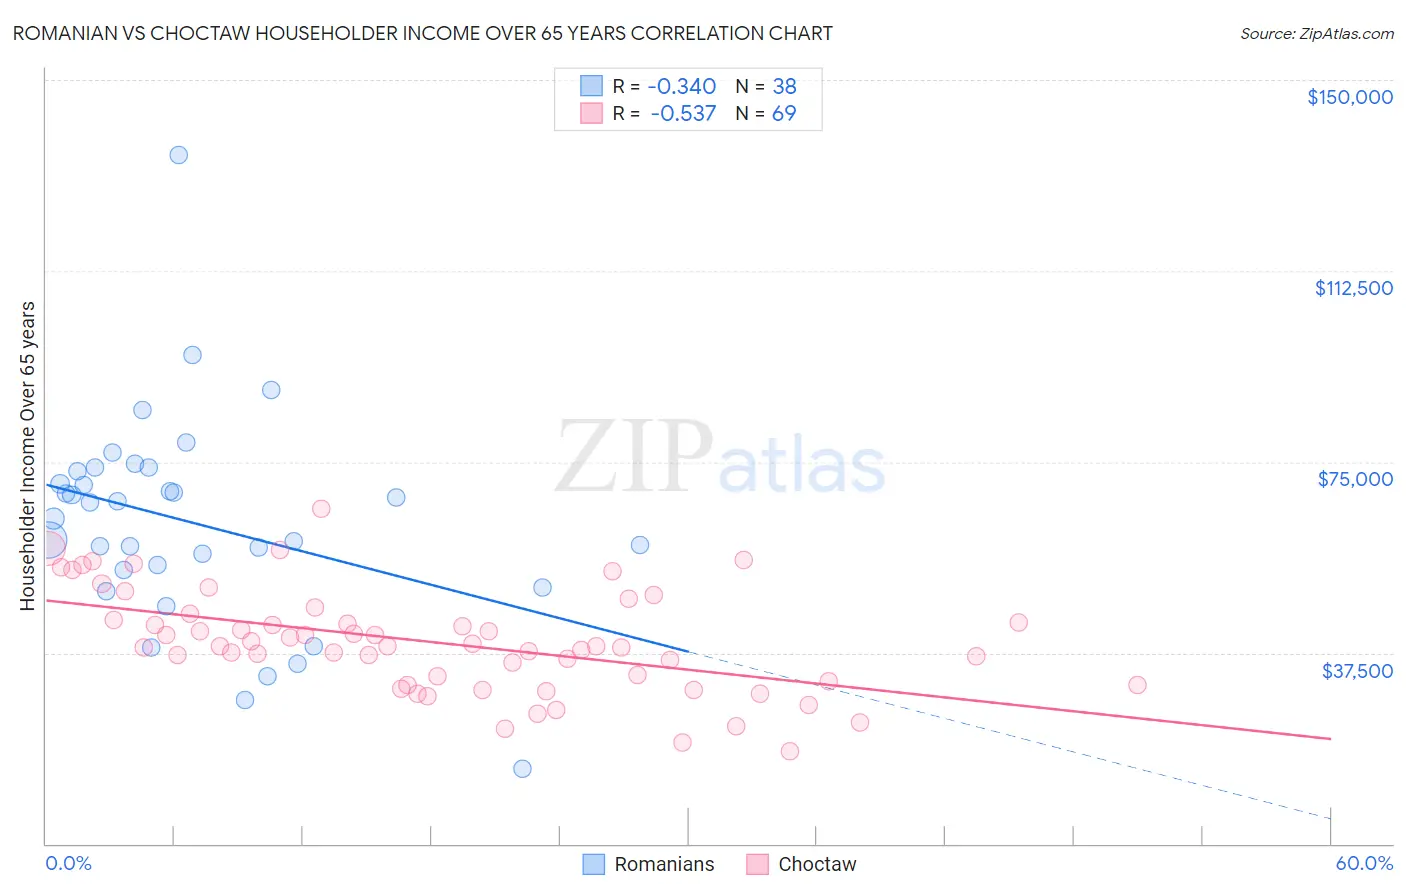
Romanian vs Choctaw Householder Income Over 65 years Correlation Chart
The statistical analysis conducted on geographies consisting of 376,856,051 people shows a mild negative correlation between the proportion of Romanians and household income with householder over the age of 65 in the United States with a correlation coefficient (R) of -0.340 and weighted average of $64,142. Similarly, the statistical analysis conducted on geographies consisting of 268,776,523 people shows a substantial negative correlation between the proportion of Choctaw and household income with householder over the age of 65 in the United States with a correlation coefficient (R) of -0.537 and weighted average of $53,060, a difference of 20.9%.
Householder Income Over 65 years Correlation Summary
| Measurement | Romanian | Choctaw |
| Minimum | $14,625 | $18,125 |
| Maximum | $135,238 | $65,690 |
| Range | $120,613 | $47,565 |
| Mean | $62,942 | $39,539 |
| Median | $65,425 | $38,767 |
| Interquartile 25% (IQ1) | $53,666 | $31,582 |
| Interquartile 75% (IQ3) | $73,079 | $44,543 |
| Interquartile Range (IQR) | $19,413 | $12,961 |
| Standard Deviation (Sample) | $20,808 | $10,045 |
| Standard Deviation (Population) | $20,532 | $9,972 |
Similar Demographics by Householder Income Over 65 years
Demographics Similar to Romanians by Householder Income Over 65 years
In terms of householder income over 65 years, the demographic groups most similar to Romanians are Assyrian/Chaldean/Syriac ($64,108, a difference of 0.050%), Immigrants from South Eastern Asia ($64,089, a difference of 0.080%), Sri Lankan ($64,201, a difference of 0.090%), Immigrants from Italy ($64,065, a difference of 0.12%), and Immigrants from Hungary ($64,277, a difference of 0.21%).
| Demographics | Rating | Rank | Householder Income Over 65 years |
| Immigrants | Oceania | 97.4 /100 | #91 | Exceptional $64,416 |
| Immigrants | Bulgaria | 97.3 /100 | #92 | Exceptional $64,379 |
| Jordanians | 97.1 /100 | #93 | Exceptional $64,313 |
| Immigrants | Egypt | 97.0 /100 | #94 | Exceptional $64,299 |
| Immigrants | Latvia | 97.0 /100 | #95 | Exceptional $64,298 |
| Immigrants | Hungary | 97.0 /100 | #96 | Exceptional $64,277 |
| Sri Lankans | 96.7 /100 | #97 | Exceptional $64,201 |
| Romanians | 96.5 /100 | #98 | Exceptional $64,142 |
| Assyrians/Chaldeans/Syriacs | 96.4 /100 | #99 | Exceptional $64,108 |
| Immigrants | South Eastern Asia | 96.3 /100 | #100 | Exceptional $64,089 |
| Immigrants | Italy | 96.2 /100 | #101 | Exceptional $64,065 |
| Chileans | 95.8 /100 | #102 | Exceptional $63,957 |
| British | 95.7 /100 | #103 | Exceptional $63,940 |
| Immigrants | Cameroon | 95.6 /100 | #104 | Exceptional $63,907 |
| Italians | 95.5 /100 | #105 | Exceptional $63,885 |
Demographics Similar to Choctaw by Householder Income Over 65 years
In terms of householder income over 65 years, the demographic groups most similar to Choctaw are Spanish American Indian ($53,077, a difference of 0.030%), Yuman ($53,110, a difference of 0.090%), Immigrants from Bahamas ($53,174, a difference of 0.21%), Ute ($52,949, a difference of 0.21%), and Pueblo ($52,930, a difference of 0.25%).
| Demographics | Rating | Rank | Householder Income Over 65 years |
| Immigrants | Somalia | 0.0 /100 | #296 | Tragic $53,333 |
| Immigrants | Latin America | 0.0 /100 | #297 | Tragic $53,265 |
| Central American Indians | 0.0 /100 | #298 | Tragic $53,232 |
| Ottawa | 0.0 /100 | #299 | Tragic $53,217 |
| Immigrants | Bahamas | 0.0 /100 | #300 | Tragic $53,174 |
| Yuman | 0.0 /100 | #301 | Tragic $53,110 |
| Spanish American Indians | 0.0 /100 | #302 | Tragic $53,077 |
| Choctaw | 0.0 /100 | #303 | Tragic $53,060 |
| Ute | 0.0 /100 | #304 | Tragic $52,949 |
| Pueblo | 0.0 /100 | #305 | Tragic $52,930 |
| Pennsylvania Germans | 0.0 /100 | #306 | Tragic $52,888 |
| Hispanics or Latinos | 0.0 /100 | #307 | Tragic $52,832 |
| Immigrants | Mexico | 0.0 /100 | #308 | Tragic $52,801 |
| Hondurans | 0.0 /100 | #309 | Tragic $52,634 |
| Sioux | 0.0 /100 | #310 | Tragic $52,509 |