Romanian vs Immigrants from North America Householder Income Over 65 years
COMPARE
Romanian
Immigrants from North America
Householder Income Over 65 years
Householder Income Over 65 years Comparison
Romanians
Immigrants from North America
$64,142
HOUSEHOLDER INCOME OVER 65 YEARS
96.5/ 100
METRIC RATING
98th/ 347
METRIC RANK
$64,856
HOUSEHOLDER INCOME OVER 65 YEARS
98.3/ 100
METRIC RATING
80th/ 347
METRIC RANK
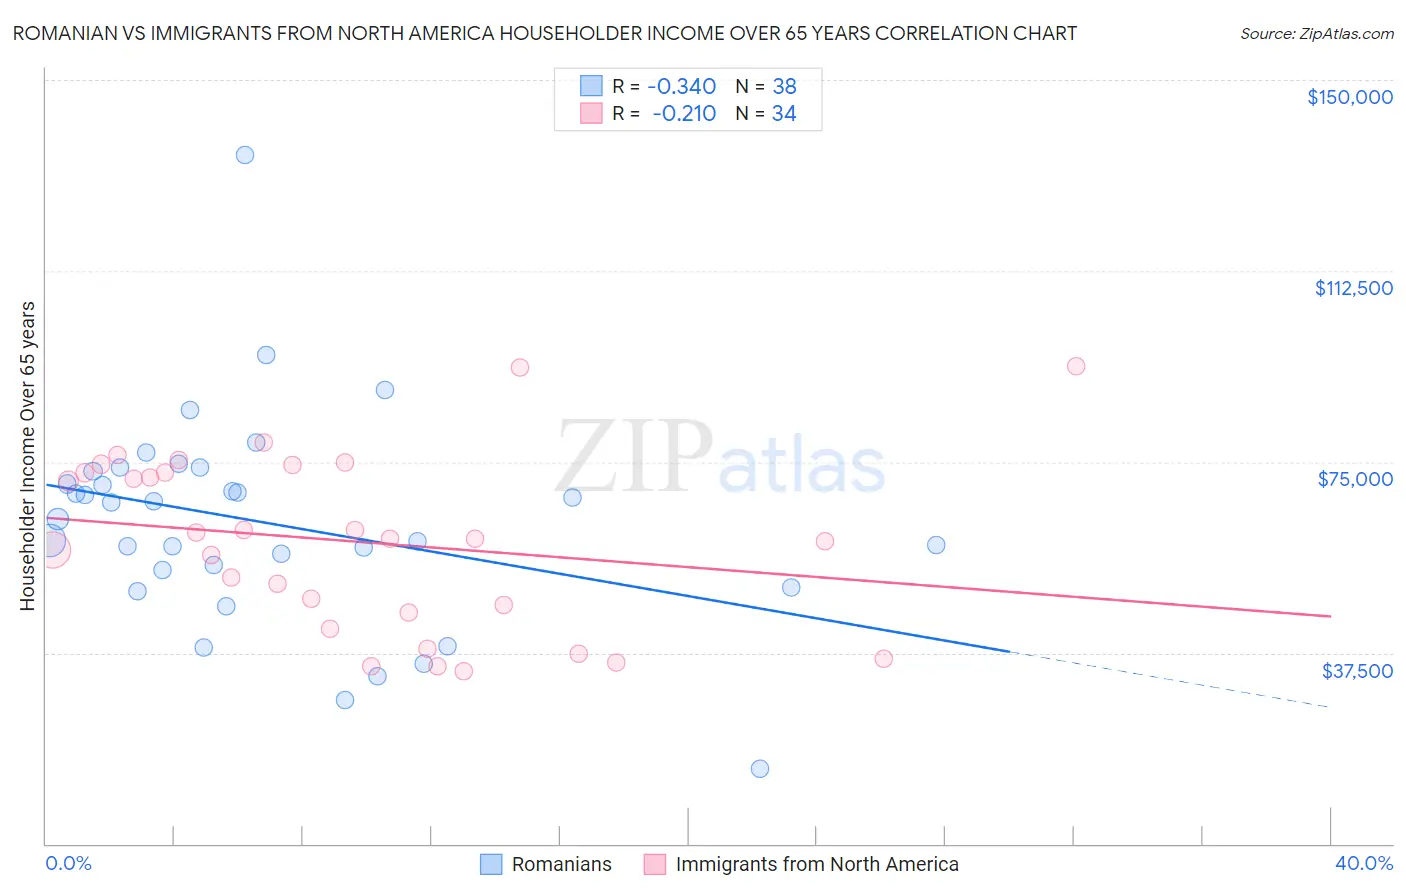
Romanian vs Immigrants from North America Householder Income Over 65 years Correlation Chart
The statistical analysis conducted on geographies consisting of 376,856,051 people shows a mild negative correlation between the proportion of Romanians and household income with householder over the age of 65 in the United States with a correlation coefficient (R) of -0.340 and weighted average of $64,142. Similarly, the statistical analysis conducted on geographies consisting of 460,797,771 people shows a weak negative correlation between the proportion of Immigrants from North America and household income with householder over the age of 65 in the United States with a correlation coefficient (R) of -0.210 and weighted average of $64,856, a difference of 1.1%.
Householder Income Over 65 years Correlation Summary
| Measurement | Romanian | Immigrants from North America |
| Minimum | $14,625 | $33,841 |
| Maximum | $135,238 | $93,750 |
| Range | $120,613 | $59,909 |
| Mean | $62,942 | $59,347 |
| Median | $65,425 | $59,957 |
| Interquartile 25% (IQ1) | $53,666 | $45,537 |
| Interquartile 75% (IQ3) | $73,079 | $72,906 |
| Interquartile Range (IQR) | $19,413 | $27,369 |
| Standard Deviation (Sample) | $20,808 | $17,042 |
| Standard Deviation (Population) | $20,532 | $16,789 |
Demographics Similar to Romanians and Immigrants from North America by Householder Income Over 65 years
In terms of householder income over 65 years, the demographic groups most similar to Romanians are Assyrian/Chaldean/Syriac ($64,108, a difference of 0.050%), Sri Lankan ($64,201, a difference of 0.090%), Immigrants from Hungary ($64,277, a difference of 0.21%), Immigrants from Egypt ($64,299, a difference of 0.24%), and Immigrants from Latvia ($64,298, a difference of 0.24%). Similarly, the demographic groups most similar to Immigrants from North America are Immigrants from Europe ($64,828, a difference of 0.040%), Immigrants from Fiji ($64,795, a difference of 0.090%), Hawaiian ($64,920, a difference of 0.10%), Northern European ($64,658, a difference of 0.31%), and Immigrants from Greece ($64,636, a difference of 0.34%).
| Demographics | Rating | Rank | Householder Income Over 65 years |
| Hawaiians | 98.4 /100 | #79 | Exceptional $64,920 |
| Immigrants | North America | 98.3 /100 | #80 | Exceptional $64,856 |
| Immigrants | Europe | 98.3 /100 | #81 | Exceptional $64,828 |
| Immigrants | Fiji | 98.2 /100 | #82 | Exceptional $64,795 |
| Northern Europeans | 97.9 /100 | #83 | Exceptional $64,658 |
| Immigrants | Greece | 97.9 /100 | #84 | Exceptional $64,636 |
| Immigrants | Lebanon | 97.6 /100 | #85 | Exceptional $64,521 |
| Immigrants | Russia | 97.6 /100 | #86 | Exceptional $64,512 |
| Austrians | 97.5 /100 | #87 | Exceptional $64,470 |
| Immigrants | Romania | 97.5 /100 | #88 | Exceptional $64,462 |
| Paraguayans | 97.4 /100 | #89 | Exceptional $64,443 |
| Immigrants | Kuwait | 97.4 /100 | #90 | Exceptional $64,433 |
| Immigrants | Oceania | 97.4 /100 | #91 | Exceptional $64,416 |
| Immigrants | Bulgaria | 97.3 /100 | #92 | Exceptional $64,379 |
| Jordanians | 97.1 /100 | #93 | Exceptional $64,313 |
| Immigrants | Egypt | 97.0 /100 | #94 | Exceptional $64,299 |
| Immigrants | Latvia | 97.0 /100 | #95 | Exceptional $64,298 |
| Immigrants | Hungary | 97.0 /100 | #96 | Exceptional $64,277 |
| Sri Lankans | 96.7 /100 | #97 | Exceptional $64,201 |
| Romanians | 96.5 /100 | #98 | Exceptional $64,142 |
| Assyrians/Chaldeans/Syriacs | 96.4 /100 | #99 | Exceptional $64,108 |