Korean vs Choctaw Householder Income Over 65 years
COMPARE
Korean
Choctaw
Householder Income Over 65 years
Householder Income Over 65 years Comparison
Koreans
Choctaw
$67,472
HOUSEHOLDER INCOME OVER 65 YEARS
99.9/ 100
METRIC RATING
41st/ 347
METRIC RANK
$53,060
HOUSEHOLDER INCOME OVER 65 YEARS
0.0/ 100
METRIC RATING
303rd/ 347
METRIC RANK
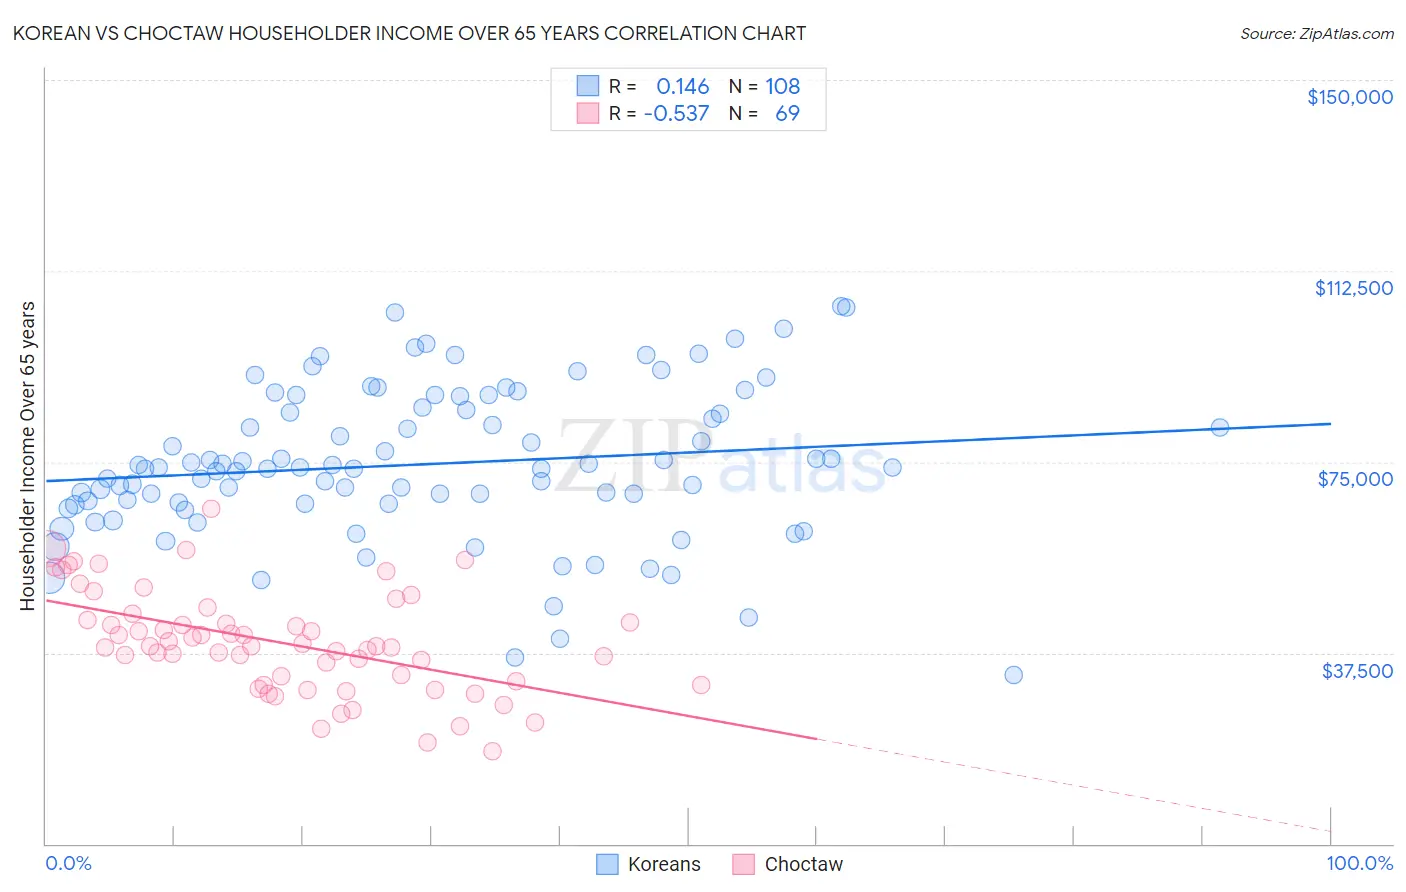
Korean vs Choctaw Householder Income Over 65 years Correlation Chart
The statistical analysis conducted on geographies consisting of 507,905,731 people shows a poor positive correlation between the proportion of Koreans and household income with householder over the age of 65 in the United States with a correlation coefficient (R) of 0.146 and weighted average of $67,472. Similarly, the statistical analysis conducted on geographies consisting of 268,776,523 people shows a substantial negative correlation between the proportion of Choctaw and household income with householder over the age of 65 in the United States with a correlation coefficient (R) of -0.537 and weighted average of $53,060, a difference of 27.2%.
Householder Income Over 65 years Correlation Summary
| Measurement | Korean | Choctaw |
| Minimum | $33,125 | $18,125 |
| Maximum | $105,510 | $65,690 |
| Range | $72,385 | $47,565 |
| Mean | $74,525 | $39,539 |
| Median | $73,782 | $38,767 |
| Interquartile 25% (IQ1) | $66,806 | $31,582 |
| Interquartile 75% (IQ3) | $85,369 | $44,543 |
| Interquartile Range (IQR) | $18,562 | $12,961 |
| Standard Deviation (Sample) | $14,819 | $10,045 |
| Standard Deviation (Population) | $14,750 | $9,972 |
Similar Demographics by Householder Income Over 65 years
Demographics Similar to Koreans by Householder Income Over 65 years
In terms of householder income over 65 years, the demographic groups most similar to Koreans are Immigrants from Asia ($67,594, a difference of 0.18%), New Zealander ($67,333, a difference of 0.21%), Latvian ($67,326, a difference of 0.22%), Russian ($67,626, a difference of 0.23%), and Immigrants from South Africa ($67,234, a difference of 0.35%).
| Demographics | Rating | Rank | Householder Income Over 65 years |
| Immigrants | Ireland | 100.0 /100 | #34 | Exceptional $68,495 |
| Tongans | 100.0 /100 | #35 | Exceptional $68,235 |
| Immigrants | Austria | 99.9 /100 | #36 | Exceptional $68,208 |
| Turks | 99.9 /100 | #37 | Exceptional $68,037 |
| Estonians | 99.9 /100 | #38 | Exceptional $67,926 |
| Russians | 99.9 /100 | #39 | Exceptional $67,626 |
| Immigrants | Asia | 99.9 /100 | #40 | Exceptional $67,594 |
| Koreans | 99.9 /100 | #41 | Exceptional $67,472 |
| New Zealanders | 99.9 /100 | #42 | Exceptional $67,333 |
| Latvians | 99.9 /100 | #43 | Exceptional $67,326 |
| Immigrants | South Africa | 99.9 /100 | #44 | Exceptional $67,234 |
| Immigrants | Afghanistan | 99.8 /100 | #45 | Exceptional $67,007 |
| Cambodians | 99.8 /100 | #46 | Exceptional $66,892 |
| Australians | 99.8 /100 | #47 | Exceptional $66,891 |
| Immigrants | France | 99.8 /100 | #48 | Exceptional $66,826 |
Demographics Similar to Choctaw by Householder Income Over 65 years
In terms of householder income over 65 years, the demographic groups most similar to Choctaw are Spanish American Indian ($53,077, a difference of 0.030%), Yuman ($53,110, a difference of 0.090%), Immigrants from Bahamas ($53,174, a difference of 0.21%), Ute ($52,949, a difference of 0.21%), and Pueblo ($52,930, a difference of 0.25%).
| Demographics | Rating | Rank | Householder Income Over 65 years |
| Immigrants | Somalia | 0.0 /100 | #296 | Tragic $53,333 |
| Immigrants | Latin America | 0.0 /100 | #297 | Tragic $53,265 |
| Central American Indians | 0.0 /100 | #298 | Tragic $53,232 |
| Ottawa | 0.0 /100 | #299 | Tragic $53,217 |
| Immigrants | Bahamas | 0.0 /100 | #300 | Tragic $53,174 |
| Yuman | 0.0 /100 | #301 | Tragic $53,110 |
| Spanish American Indians | 0.0 /100 | #302 | Tragic $53,077 |
| Choctaw | 0.0 /100 | #303 | Tragic $53,060 |
| Ute | 0.0 /100 | #304 | Tragic $52,949 |
| Pueblo | 0.0 /100 | #305 | Tragic $52,930 |
| Pennsylvania Germans | 0.0 /100 | #306 | Tragic $52,888 |
| Hispanics or Latinos | 0.0 /100 | #307 | Tragic $52,832 |
| Immigrants | Mexico | 0.0 /100 | #308 | Tragic $52,801 |
| Hondurans | 0.0 /100 | #309 | Tragic $52,634 |
| Sioux | 0.0 /100 | #310 | Tragic $52,509 |