Immigrants from Greece vs Choctaw Householder Income Over 65 years
COMPARE
Immigrants from Greece
Choctaw
Householder Income Over 65 years
Householder Income Over 65 years Comparison
Immigrants from Greece
Choctaw
$64,636
HOUSEHOLDER INCOME OVER 65 YEARS
97.9/ 100
METRIC RATING
84th/ 347
METRIC RANK
$53,060
HOUSEHOLDER INCOME OVER 65 YEARS
0.0/ 100
METRIC RATING
303rd/ 347
METRIC RANK
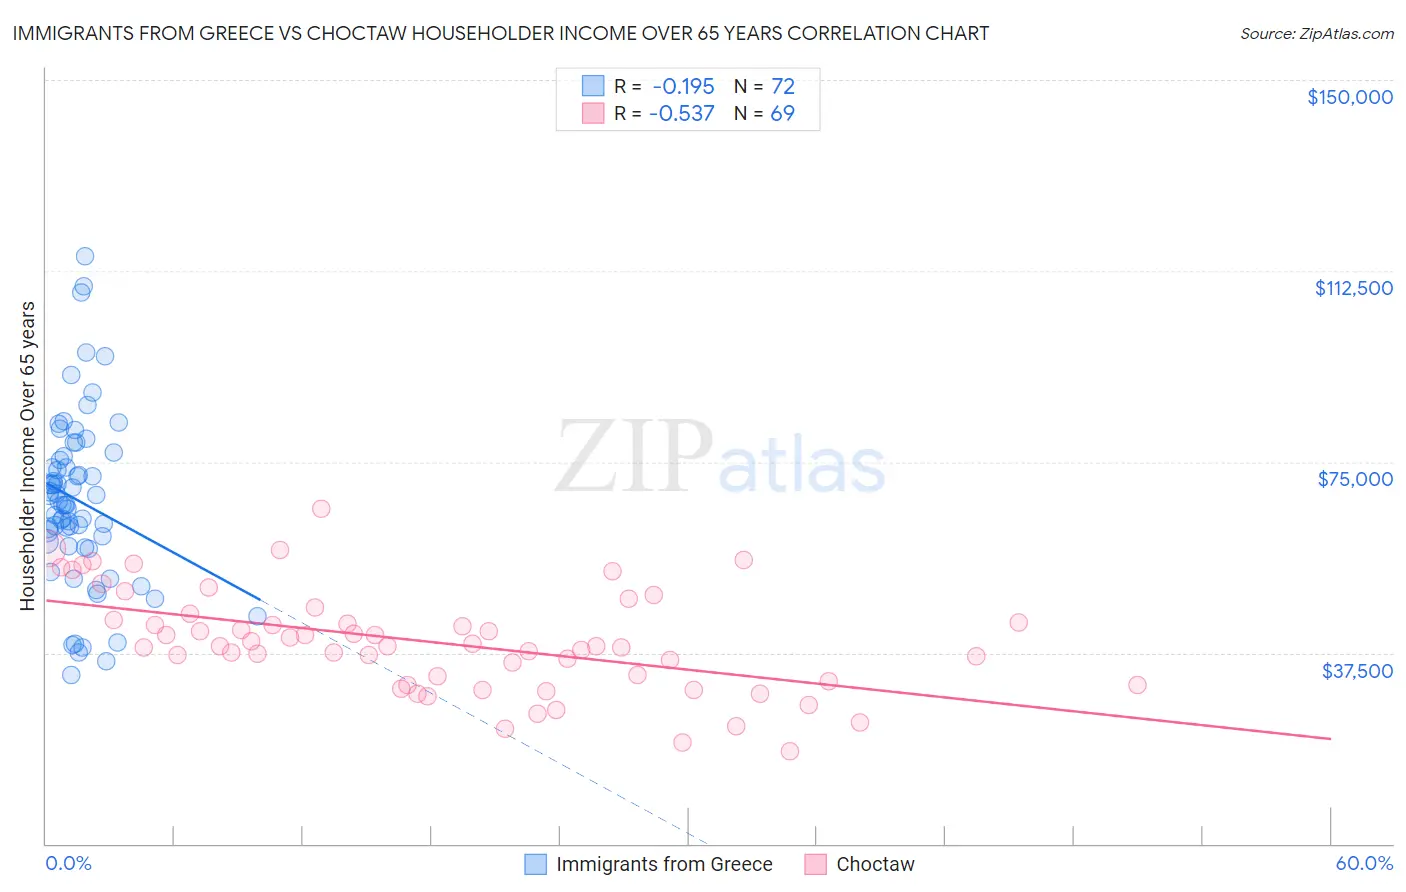
Immigrants from Greece vs Choctaw Householder Income Over 65 years Correlation Chart
The statistical analysis conducted on geographies consisting of 216,676,886 people shows a poor negative correlation between the proportion of Immigrants from Greece and household income with householder over the age of 65 in the United States with a correlation coefficient (R) of -0.195 and weighted average of $64,636. Similarly, the statistical analysis conducted on geographies consisting of 268,776,523 people shows a substantial negative correlation between the proportion of Choctaw and household income with householder over the age of 65 in the United States with a correlation coefficient (R) of -0.537 and weighted average of $53,060, a difference of 21.8%.
Householder Income Over 65 years Correlation Summary
| Measurement | Immigrants from Greece | Choctaw |
| Minimum | $33,062 | $18,125 |
| Maximum | $115,263 | $65,690 |
| Range | $82,200 | $47,565 |
| Mean | $67,357 | $39,539 |
| Median | $66,928 | $38,767 |
| Interquartile 25% (IQ1) | $58,960 | $31,582 |
| Interquartile 75% (IQ3) | $75,732 | $44,543 |
| Interquartile Range (IQR) | $16,773 | $12,961 |
| Standard Deviation (Sample) | $16,859 | $10,045 |
| Standard Deviation (Population) | $16,741 | $9,972 |
Similar Demographics by Householder Income Over 65 years
Demographics Similar to Immigrants from Greece by Householder Income Over 65 years
In terms of householder income over 65 years, the demographic groups most similar to Immigrants from Greece are Northern European ($64,658, a difference of 0.030%), Immigrants from Lebanon ($64,521, a difference of 0.18%), Immigrants from Russia ($64,512, a difference of 0.19%), Immigrants from Fiji ($64,795, a difference of 0.25%), and Austrian ($64,470, a difference of 0.26%).
| Demographics | Rating | Rank | Householder Income Over 65 years |
| Immigrants | Canada | 98.5 /100 | #77 | Exceptional $64,952 |
| Immigrants | Western Europe | 98.5 /100 | #78 | Exceptional $64,933 |
| Hawaiians | 98.4 /100 | #79 | Exceptional $64,920 |
| Immigrants | North America | 98.3 /100 | #80 | Exceptional $64,856 |
| Immigrants | Europe | 98.3 /100 | #81 | Exceptional $64,828 |
| Immigrants | Fiji | 98.2 /100 | #82 | Exceptional $64,795 |
| Northern Europeans | 97.9 /100 | #83 | Exceptional $64,658 |
| Immigrants | Greece | 97.9 /100 | #84 | Exceptional $64,636 |
| Immigrants | Lebanon | 97.6 /100 | #85 | Exceptional $64,521 |
| Immigrants | Russia | 97.6 /100 | #86 | Exceptional $64,512 |
| Austrians | 97.5 /100 | #87 | Exceptional $64,470 |
| Immigrants | Romania | 97.5 /100 | #88 | Exceptional $64,462 |
| Paraguayans | 97.4 /100 | #89 | Exceptional $64,443 |
| Immigrants | Kuwait | 97.4 /100 | #90 | Exceptional $64,433 |
| Immigrants | Oceania | 97.4 /100 | #91 | Exceptional $64,416 |
Demographics Similar to Choctaw by Householder Income Over 65 years
In terms of householder income over 65 years, the demographic groups most similar to Choctaw are Spanish American Indian ($53,077, a difference of 0.030%), Yuman ($53,110, a difference of 0.090%), Immigrants from Bahamas ($53,174, a difference of 0.21%), Ute ($52,949, a difference of 0.21%), and Pueblo ($52,930, a difference of 0.25%).
| Demographics | Rating | Rank | Householder Income Over 65 years |
| Immigrants | Somalia | 0.0 /100 | #296 | Tragic $53,333 |
| Immigrants | Latin America | 0.0 /100 | #297 | Tragic $53,265 |
| Central American Indians | 0.0 /100 | #298 | Tragic $53,232 |
| Ottawa | 0.0 /100 | #299 | Tragic $53,217 |
| Immigrants | Bahamas | 0.0 /100 | #300 | Tragic $53,174 |
| Yuman | 0.0 /100 | #301 | Tragic $53,110 |
| Spanish American Indians | 0.0 /100 | #302 | Tragic $53,077 |
| Choctaw | 0.0 /100 | #303 | Tragic $53,060 |
| Ute | 0.0 /100 | #304 | Tragic $52,949 |
| Pueblo | 0.0 /100 | #305 | Tragic $52,930 |
| Pennsylvania Germans | 0.0 /100 | #306 | Tragic $52,888 |
| Hispanics or Latinos | 0.0 /100 | #307 | Tragic $52,832 |
| Immigrants | Mexico | 0.0 /100 | #308 | Tragic $52,801 |
| Hondurans | 0.0 /100 | #309 | Tragic $52,634 |
| Sioux | 0.0 /100 | #310 | Tragic $52,509 |