Creek vs Choctaw Householder Income Over 65 years
COMPARE
Creek
Choctaw
Householder Income Over 65 years
Householder Income Over 65 years Comparison
Creek
Choctaw
$51,949
HOUSEHOLDER INCOME OVER 65 YEARS
0.0/ 100
METRIC RATING
316th/ 347
METRIC RANK
$53,060
HOUSEHOLDER INCOME OVER 65 YEARS
0.0/ 100
METRIC RATING
303rd/ 347
METRIC RANK
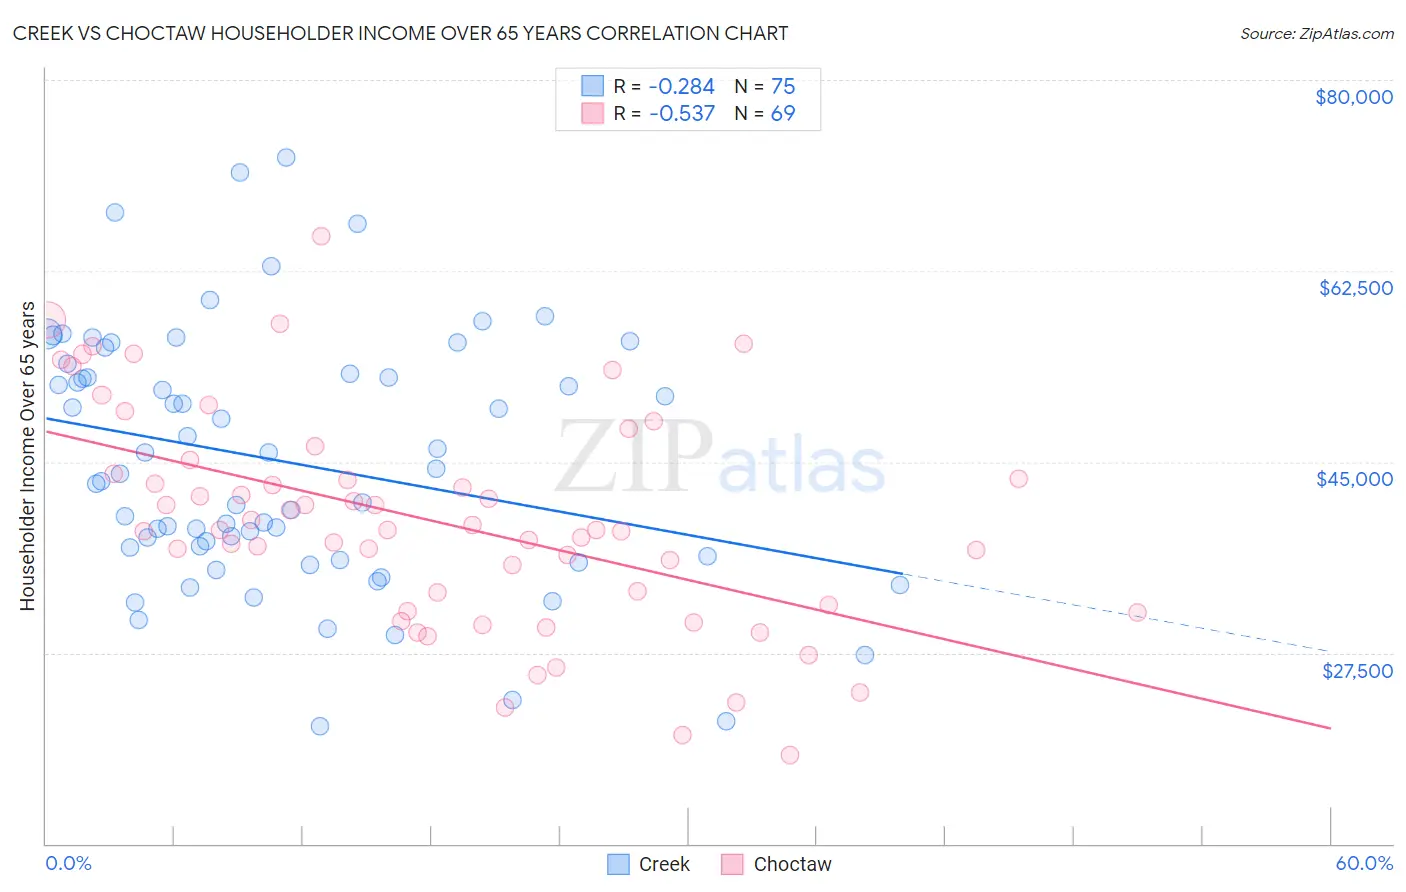
Creek vs Choctaw Householder Income Over 65 years Correlation Chart
The statistical analysis conducted on geographies consisting of 178,125,248 people shows a weak negative correlation between the proportion of Creek and household income with householder over the age of 65 in the United States with a correlation coefficient (R) of -0.284 and weighted average of $51,949. Similarly, the statistical analysis conducted on geographies consisting of 268,776,523 people shows a substantial negative correlation between the proportion of Choctaw and household income with householder over the age of 65 in the United States with a correlation coefficient (R) of -0.537 and weighted average of $53,060, a difference of 2.1%.
Householder Income Over 65 years Correlation Summary
| Measurement | Creek | Choctaw |
| Minimum | $20,781 | $18,125 |
| Maximum | $72,903 | $65,690 |
| Range | $52,122 | $47,565 |
| Mean | $45,013 | $39,539 |
| Median | $43,886 | $38,767 |
| Interquartile 25% (IQ1) | $36,375 | $31,582 |
| Interquartile 75% (IQ3) | $53,125 | $44,543 |
| Interquartile Range (IQR) | $16,750 | $12,961 |
| Standard Deviation (Sample) | $11,525 | $10,045 |
| Standard Deviation (Population) | $11,448 | $9,972 |
Demographics Similar to Creek and Choctaw by Householder Income Over 65 years
In terms of householder income over 65 years, the demographic groups most similar to Creek are Immigrants from St. Vincent and the Grenadines ($51,922, a difference of 0.050%), Haitian ($51,912, a difference of 0.070%), Immigrants from Honduras ($51,888, a difference of 0.12%), U.S. Virgin Islander ($52,072, a difference of 0.24%), and Native/Alaskan ($52,081, a difference of 0.25%). Similarly, the demographic groups most similar to Choctaw are Spanish American Indian ($53,077, a difference of 0.030%), Yuman ($53,110, a difference of 0.090%), Immigrants from Bahamas ($53,174, a difference of 0.21%), Ute ($52,949, a difference of 0.21%), and Pueblo ($52,930, a difference of 0.25%).
| Demographics | Rating | Rank | Householder Income Over 65 years |
| Ottawa | 0.0 /100 | #299 | Tragic $53,217 |
| Immigrants | Bahamas | 0.0 /100 | #300 | Tragic $53,174 |
| Yuman | 0.0 /100 | #301 | Tragic $53,110 |
| Spanish American Indians | 0.0 /100 | #302 | Tragic $53,077 |
| Choctaw | 0.0 /100 | #303 | Tragic $53,060 |
| Ute | 0.0 /100 | #304 | Tragic $52,949 |
| Pueblo | 0.0 /100 | #305 | Tragic $52,930 |
| Pennsylvania Germans | 0.0 /100 | #306 | Tragic $52,888 |
| Hispanics or Latinos | 0.0 /100 | #307 | Tragic $52,832 |
| Immigrants | Mexico | 0.0 /100 | #308 | Tragic $52,801 |
| Hondurans | 0.0 /100 | #309 | Tragic $52,634 |
| Sioux | 0.0 /100 | #310 | Tragic $52,509 |
| Seminole | 0.0 /100 | #311 | Tragic $52,373 |
| Immigrants | Azores | 0.0 /100 | #312 | Tragic $52,121 |
| Immigrants | Nicaragua | 0.0 /100 | #313 | Tragic $52,085 |
| Natives/Alaskans | 0.0 /100 | #314 | Tragic $52,081 |
| U.S. Virgin Islanders | 0.0 /100 | #315 | Tragic $52,072 |
| Creek | 0.0 /100 | #316 | Tragic $51,949 |
| Immigrants | St. Vincent and the Grenadines | 0.0 /100 | #317 | Tragic $51,922 |
| Haitians | 0.0 /100 | #318 | Tragic $51,912 |
| Immigrants | Honduras | 0.0 /100 | #319 | Tragic $51,888 |