Romanian vs Austrian No Schooling Completed
COMPARE
Romanian
Austrian
No Schooling Completed
No Schooling Completed Comparison
Romanians
Austrians
1.8%
NO SCHOOLING COMPLETED
98.8/ 100
METRIC RATING
92nd/ 347
METRIC RANK
1.6%
NO SCHOOLING COMPLETED
99.8/ 100
METRIC RATING
57th/ 347
METRIC RANK
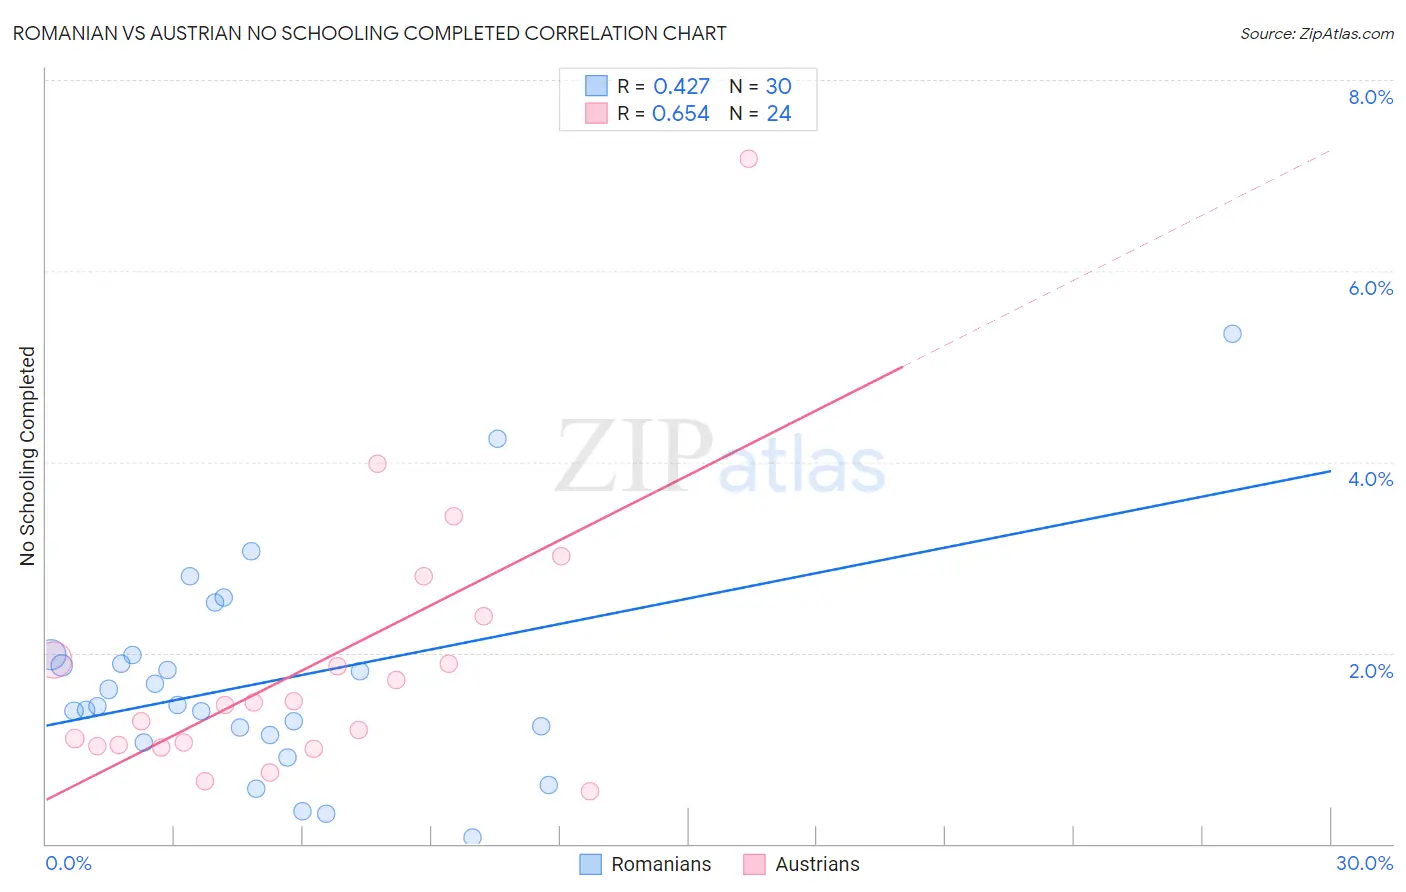
Romanian vs Austrian No Schooling Completed Correlation Chart
The statistical analysis conducted on geographies consisting of 373,712,134 people shows a moderate positive correlation between the proportion of Romanians and percentage of population with no schooling in the United States with a correlation coefficient (R) of 0.427 and weighted average of 1.8%. Similarly, the statistical analysis conducted on geographies consisting of 443,991,525 people shows a significant positive correlation between the proportion of Austrians and percentage of population with no schooling in the United States with a correlation coefficient (R) of 0.654 and weighted average of 1.6%, a difference of 8.2%.
No Schooling Completed Correlation Summary
| Measurement | Romanian | Austrian |
| Minimum | 0.062% | 0.55% |
| Maximum | 5.3% | 7.2% |
| Range | 5.3% | 6.6% |
| Mean | 1.7% | 1.9% |
| Median | 1.4% | 1.5% |
| Interquartile 25% (IQ1) | 1.1% | 1.0% |
| Interquartile 75% (IQ3) | 2.0% | 2.2% |
| Interquartile Range (IQR) | 0.83% | 1.1% |
| Standard Deviation (Sample) | 1.1% | 1.4% |
| Standard Deviation (Population) | 1.1% | 1.4% |
Similar Demographics by No Schooling Completed
Demographics Similar to Romanians by No Schooling Completed
In terms of no schooling completed, the demographic groups most similar to Romanians are Turkish (1.8%, a difference of 0.37%), Immigrants from Germany (1.8%, a difference of 0.52%), Sioux (1.8%, a difference of 0.62%), Nonimmigrants (1.8%, a difference of 0.87%), and Puget Sound Salish (1.8%, a difference of 0.88%).
| Demographics | Rating | Rank | No Schooling Completed |
| Immigrants | Australia | 99.2 /100 | #85 | Exceptional 1.7% |
| Ukrainians | 99.2 /100 | #86 | Exceptional 1.8% |
| Osage | 99.2 /100 | #87 | Exceptional 1.8% |
| Immigrants | Western Europe | 99.2 /100 | #88 | Exceptional 1.8% |
| South Africans | 99.1 /100 | #89 | Exceptional 1.8% |
| Sioux | 99.0 /100 | #90 | Exceptional 1.8% |
| Immigrants | Germany | 99.0 /100 | #91 | Exceptional 1.8% |
| Romanians | 98.8 /100 | #92 | Exceptional 1.8% |
| Turks | 98.7 /100 | #93 | Exceptional 1.8% |
| Immigrants | Nonimmigrants | 98.5 /100 | #94 | Exceptional 1.8% |
| Puget Sound Salish | 98.5 /100 | #95 | Exceptional 1.8% |
| Bhutanese | 98.4 /100 | #96 | Exceptional 1.8% |
| Immigrants | Ireland | 98.4 /100 | #97 | Exceptional 1.8% |
| Iranians | 98.2 /100 | #98 | Exceptional 1.8% |
| Choctaw | 98.1 /100 | #99 | Exceptional 1.8% |
Demographics Similar to Austrians by No Schooling Completed
In terms of no schooling completed, the demographic groups most similar to Austrians are Kiowa (1.6%, a difference of 0.16%), Slavic (1.7%, a difference of 0.23%), Greek (1.6%, a difference of 0.31%), Immigrants from North America (1.6%, a difference of 0.31%), and American (1.7%, a difference of 0.35%).
| Demographics | Rating | Rank | No Schooling Completed |
| Celtics | 99.9 /100 | #50 | Exceptional 1.6% |
| Chippewa | 99.8 /100 | #51 | Exceptional 1.6% |
| Immigrants | Canada | 99.8 /100 | #52 | Exceptional 1.6% |
| Creek | 99.8 /100 | #53 | Exceptional 1.6% |
| Crow | 99.8 /100 | #54 | Exceptional 1.6% |
| Greeks | 99.8 /100 | #55 | Exceptional 1.6% |
| Immigrants | North America | 99.8 /100 | #56 | Exceptional 1.6% |
| Austrians | 99.8 /100 | #57 | Exceptional 1.6% |
| Kiowa | 99.8 /100 | #58 | Exceptional 1.6% |
| Slavs | 99.8 /100 | #59 | Exceptional 1.7% |
| Americans | 99.8 /100 | #60 | Exceptional 1.7% |
| Tsimshian | 99.8 /100 | #61 | Exceptional 1.7% |
| Immigrants | Northern Europe | 99.8 /100 | #62 | Exceptional 1.7% |
| Russians | 99.8 /100 | #63 | Exceptional 1.7% |
| New Zealanders | 99.7 /100 | #64 | Exceptional 1.7% |