Immigrants from Senegal vs Immigrants from Serbia Median Earnings
COMPARE
Immigrants from Senegal
Immigrants from Serbia
Median Earnings
Median Earnings Comparison
Immigrants from Senegal
Immigrants from Serbia
$45,611
MEDIAN EARNINGS
24.0/ 100
METRIC RATING
207th/ 347
METRIC RANK
$51,557
MEDIAN EARNINGS
99.9/ 100
METRIC RATING
60th/ 347
METRIC RANK
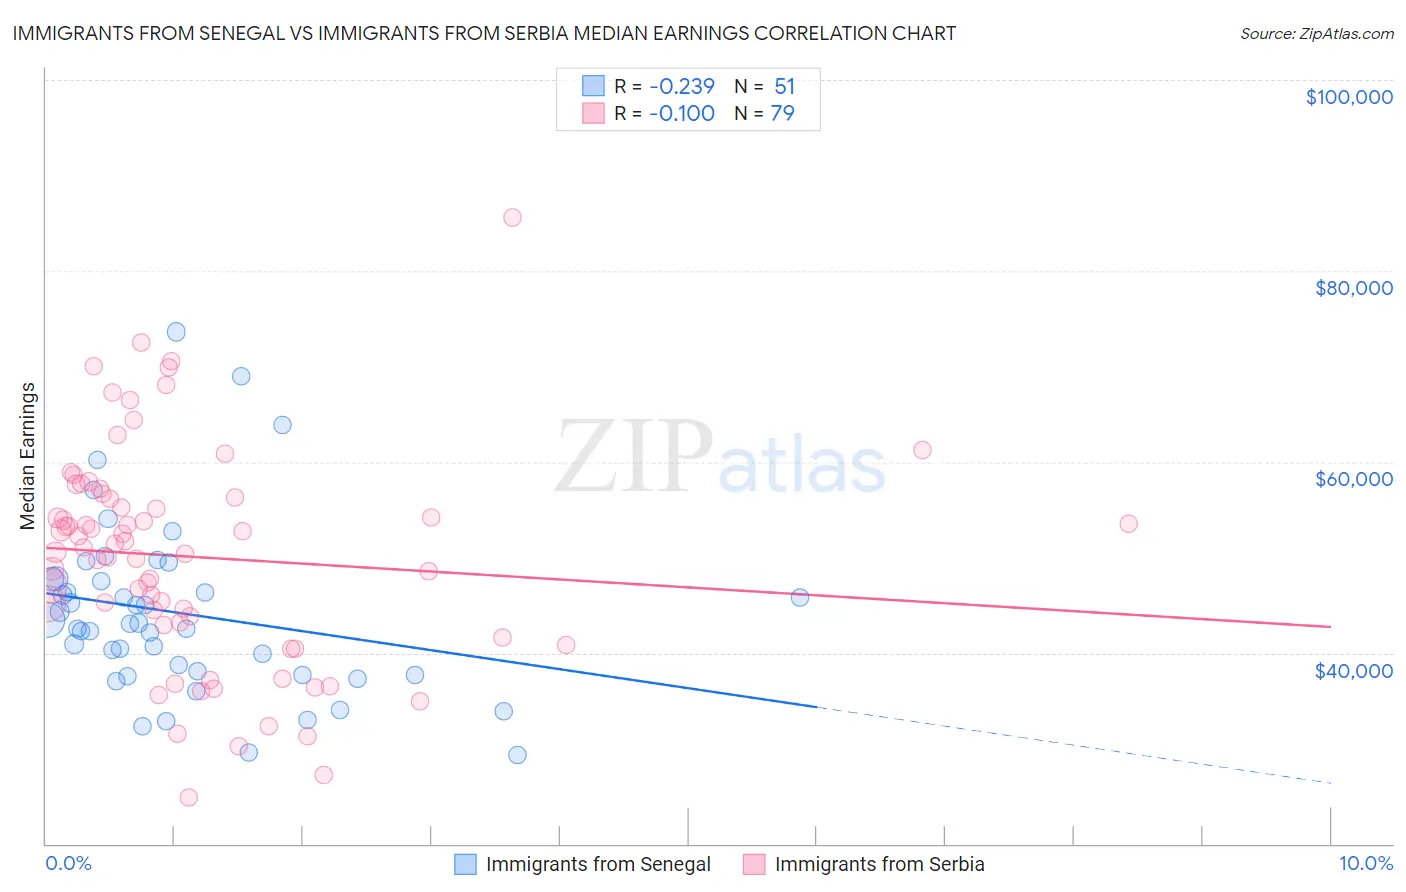
Immigrants from Senegal vs Immigrants from Serbia Median Earnings Correlation Chart
The statistical analysis conducted on geographies consisting of 90,128,045 people shows a weak negative correlation between the proportion of Immigrants from Senegal and median earnings in the United States with a correlation coefficient (R) of -0.239 and weighted average of $45,611. Similarly, the statistical analysis conducted on geographies consisting of 131,742,589 people shows a slight negative correlation between the proportion of Immigrants from Serbia and median earnings in the United States with a correlation coefficient (R) of -0.100 and weighted average of $51,557, a difference of 13.0%.
Median Earnings Correlation Summary
| Measurement | Immigrants from Senegal | Immigrants from Serbia |
| Minimum | $29,284 | $24,850 |
| Maximum | $73,618 | $85,578 |
| Range | $44,334 | $60,728 |
| Mean | $44,131 | $50,027 |
| Median | $43,043 | $50,986 |
| Interquartile 25% (IQ1) | $37,628 | $42,944 |
| Interquartile 75% (IQ3) | $47,719 | $56,219 |
| Interquartile Range (IQR) | $10,091 | $13,275 |
| Standard Deviation (Sample) | $9,098 | $11,396 |
| Standard Deviation (Population) | $9,008 | $11,323 |
Similar Demographics by Median Earnings
Demographics Similar to Immigrants from Senegal by Median Earnings
In terms of median earnings, the demographic groups most similar to Immigrants from Senegal are Immigrants from Bosnia and Herzegovina ($45,600, a difference of 0.020%), Immigrants from Thailand ($45,598, a difference of 0.030%), Immigrants from Grenada ($45,596, a difference of 0.030%), Panamanian ($45,593, a difference of 0.040%), and Bermudan ($45,593, a difference of 0.040%).
| Demographics | Rating | Rank | Median Earnings |
| Immigrants | Azores | 29.5 /100 | #200 | Fair $45,812 |
| Celtics | 27.2 /100 | #201 | Fair $45,732 |
| Immigrants | Trinidad and Tobago | 27.1 /100 | #202 | Fair $45,729 |
| Welsh | 26.6 /100 | #203 | Fair $45,710 |
| Immigrants | Uruguay | 25.9 /100 | #204 | Fair $45,682 |
| Tongans | 25.4 /100 | #205 | Fair $45,665 |
| Immigrants | Ghana | 24.8 /100 | #206 | Fair $45,641 |
| Immigrants | Senegal | 24.0 /100 | #207 | Fair $45,611 |
| Immigrants | Bosnia and Herzegovina | 23.7 /100 | #208 | Fair $45,600 |
| Immigrants | Thailand | 23.7 /100 | #209 | Fair $45,598 |
| Immigrants | Grenada | 23.6 /100 | #210 | Fair $45,596 |
| Panamanians | 23.5 /100 | #211 | Fair $45,593 |
| Bermudans | 23.5 /100 | #212 | Fair $45,593 |
| Immigrants | Colombia | 22.4 /100 | #213 | Fair $45,550 |
| Nigerians | 22.0 /100 | #214 | Fair $45,532 |
Demographics Similar to Immigrants from Serbia by Median Earnings
In terms of median earnings, the demographic groups most similar to Immigrants from Serbia are Immigrants from Latvia ($51,555, a difference of 0.0%), Immigrants from Croatia ($51,581, a difference of 0.050%), Immigrants from Bolivia ($51,605, a difference of 0.090%), Immigrants from Eastern Europe ($51,624, a difference of 0.13%), and Immigrants from Pakistan ($51,693, a difference of 0.26%).
| Demographics | Rating | Rank | Median Earnings |
| Immigrants | Norway | 99.9 /100 | #53 | Exceptional $51,758 |
| Immigrants | Indonesia | 99.9 /100 | #54 | Exceptional $51,715 |
| Egyptians | 99.9 /100 | #55 | Exceptional $51,701 |
| Immigrants | Pakistan | 99.9 /100 | #56 | Exceptional $51,693 |
| Immigrants | Eastern Europe | 99.9 /100 | #57 | Exceptional $51,624 |
| Immigrants | Bolivia | 99.9 /100 | #58 | Exceptional $51,605 |
| Immigrants | Croatia | 99.9 /100 | #59 | Exceptional $51,581 |
| Immigrants | Serbia | 99.9 /100 | #60 | Exceptional $51,557 |
| Immigrants | Latvia | 99.9 /100 | #61 | Exceptional $51,555 |
| Immigrants | Romania | 99.9 /100 | #62 | Exceptional $51,337 |
| Immigrants | Bulgaria | 99.9 /100 | #63 | Exceptional $51,318 |
| New Zealanders | 99.9 /100 | #64 | Exceptional $51,246 |
| Greeks | 99.9 /100 | #65 | Exceptional $51,164 |
| Afghans | 99.9 /100 | #66 | Exceptional $51,112 |
| Immigrants | Spain | 99.9 /100 | #67 | Exceptional $51,092 |