Immigrants from Jamaica vs Immigrants from Serbia Median Earnings
COMPARE
Immigrants from Jamaica
Immigrants from Serbia
Median Earnings
Median Earnings Comparison
Immigrants from Jamaica
Immigrants from Serbia
$43,026
MEDIAN EARNINGS
0.8/ 100
METRIC RATING
261st/ 347
METRIC RANK
$51,557
MEDIAN EARNINGS
99.9/ 100
METRIC RATING
60th/ 347
METRIC RANK
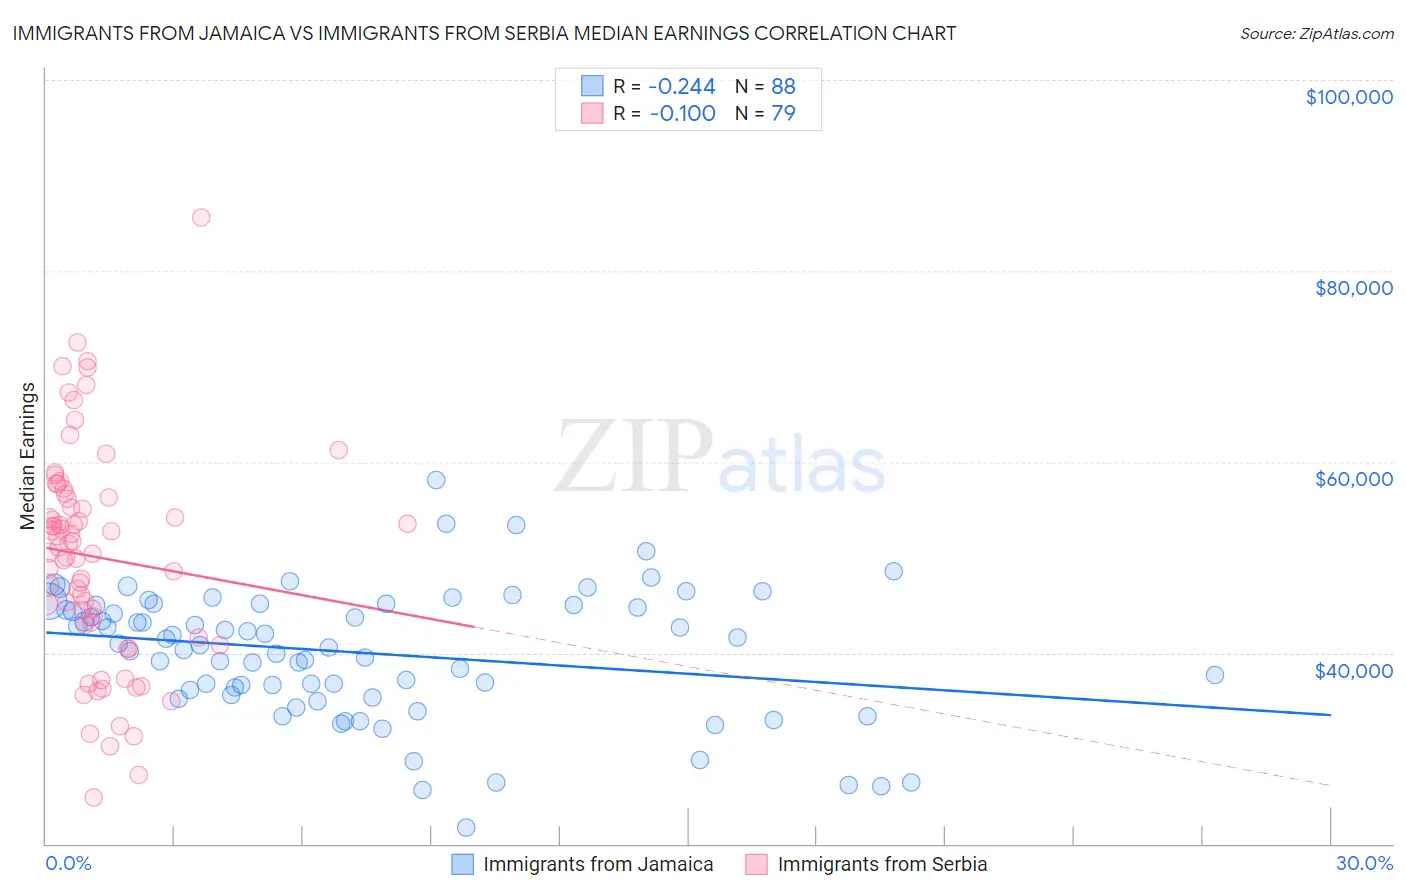
Immigrants from Jamaica vs Immigrants from Serbia Median Earnings Correlation Chart
The statistical analysis conducted on geographies consisting of 301,808,266 people shows a weak negative correlation between the proportion of Immigrants from Jamaica and median earnings in the United States with a correlation coefficient (R) of -0.244 and weighted average of $43,026. Similarly, the statistical analysis conducted on geographies consisting of 131,742,589 people shows a slight negative correlation between the proportion of Immigrants from Serbia and median earnings in the United States with a correlation coefficient (R) of -0.100 and weighted average of $51,557, a difference of 19.8%.
Median Earnings Correlation Summary
| Measurement | Immigrants from Jamaica | Immigrants from Serbia |
| Minimum | $21,741 | $24,850 |
| Maximum | $58,155 | $85,578 |
| Range | $36,414 | $60,728 |
| Mean | $40,000 | $50,027 |
| Median | $40,853 | $50,986 |
| Interquartile 25% (IQ1) | $35,870 | $42,944 |
| Interquartile 75% (IQ3) | $44,978 | $56,219 |
| Interquartile Range (IQR) | $9,108 | $13,275 |
| Standard Deviation (Sample) | $6,782 | $11,396 |
| Standard Deviation (Population) | $6,743 | $11,323 |
Similar Demographics by Median Earnings
Demographics Similar to Immigrants from Jamaica by Median Earnings
In terms of median earnings, the demographic groups most similar to Immigrants from Jamaica are Nicaraguan ($43,026, a difference of 0.0%), Inupiat ($43,000, a difference of 0.060%), Immigrants from Somalia ($43,100, a difference of 0.17%), Immigrants from Liberia ($42,923, a difference of 0.24%), and Salvadoran ($42,912, a difference of 0.27%).
| Demographics | Rating | Rank | Median Earnings |
| Liberians | 1.7 /100 | #254 | Tragic $43,536 |
| Immigrants | Middle Africa | 1.4 /100 | #255 | Tragic $43,416 |
| Alaskan Athabascans | 1.4 /100 | #256 | Tragic $43,393 |
| Jamaicans | 1.3 /100 | #257 | Tragic $43,343 |
| French American Indians | 1.3 /100 | #258 | Tragic $43,333 |
| German Russians | 1.1 /100 | #259 | Tragic $43,200 |
| Immigrants | Somalia | 0.9 /100 | #260 | Tragic $43,100 |
| Immigrants | Jamaica | 0.8 /100 | #261 | Tragic $43,026 |
| Nicaraguans | 0.8 /100 | #262 | Tragic $43,026 |
| Inupiat | 0.8 /100 | #263 | Tragic $43,000 |
| Immigrants | Liberia | 0.7 /100 | #264 | Tragic $42,923 |
| Salvadorans | 0.7 /100 | #265 | Tragic $42,912 |
| Immigrants | Laos | 0.7 /100 | #266 | Tragic $42,884 |
| Cree | 0.6 /100 | #267 | Tragic $42,777 |
| Americans | 0.6 /100 | #268 | Tragic $42,742 |
Demographics Similar to Immigrants from Serbia by Median Earnings
In terms of median earnings, the demographic groups most similar to Immigrants from Serbia are Immigrants from Latvia ($51,555, a difference of 0.0%), Immigrants from Croatia ($51,581, a difference of 0.050%), Immigrants from Bolivia ($51,605, a difference of 0.090%), Immigrants from Eastern Europe ($51,624, a difference of 0.13%), and Immigrants from Pakistan ($51,693, a difference of 0.26%).
| Demographics | Rating | Rank | Median Earnings |
| Immigrants | Norway | 99.9 /100 | #53 | Exceptional $51,758 |
| Immigrants | Indonesia | 99.9 /100 | #54 | Exceptional $51,715 |
| Egyptians | 99.9 /100 | #55 | Exceptional $51,701 |
| Immigrants | Pakistan | 99.9 /100 | #56 | Exceptional $51,693 |
| Immigrants | Eastern Europe | 99.9 /100 | #57 | Exceptional $51,624 |
| Immigrants | Bolivia | 99.9 /100 | #58 | Exceptional $51,605 |
| Immigrants | Croatia | 99.9 /100 | #59 | Exceptional $51,581 |
| Immigrants | Serbia | 99.9 /100 | #60 | Exceptional $51,557 |
| Immigrants | Latvia | 99.9 /100 | #61 | Exceptional $51,555 |
| Immigrants | Romania | 99.9 /100 | #62 | Exceptional $51,337 |
| Immigrants | Bulgaria | 99.9 /100 | #63 | Exceptional $51,318 |
| New Zealanders | 99.9 /100 | #64 | Exceptional $51,246 |
| Greeks | 99.9 /100 | #65 | Exceptional $51,164 |
| Afghans | 99.9 /100 | #66 | Exceptional $51,112 |
| Immigrants | Spain | 99.9 /100 | #67 | Exceptional $51,092 |