Puerto Rican vs British West Indian Associate's Degree
COMPARE
Puerto Rican
British West Indian
Associate's Degree
Associate's Degree Comparison
Puerto Ricans
British West Indians
40.4%
ASSOCIATE'S DEGREE
0.1/ 100
METRIC RATING
276th/ 347
METRIC RANK
42.4%
ASSOCIATE'S DEGREE
1.0/ 100
METRIC RATING
241st/ 347
METRIC RANK
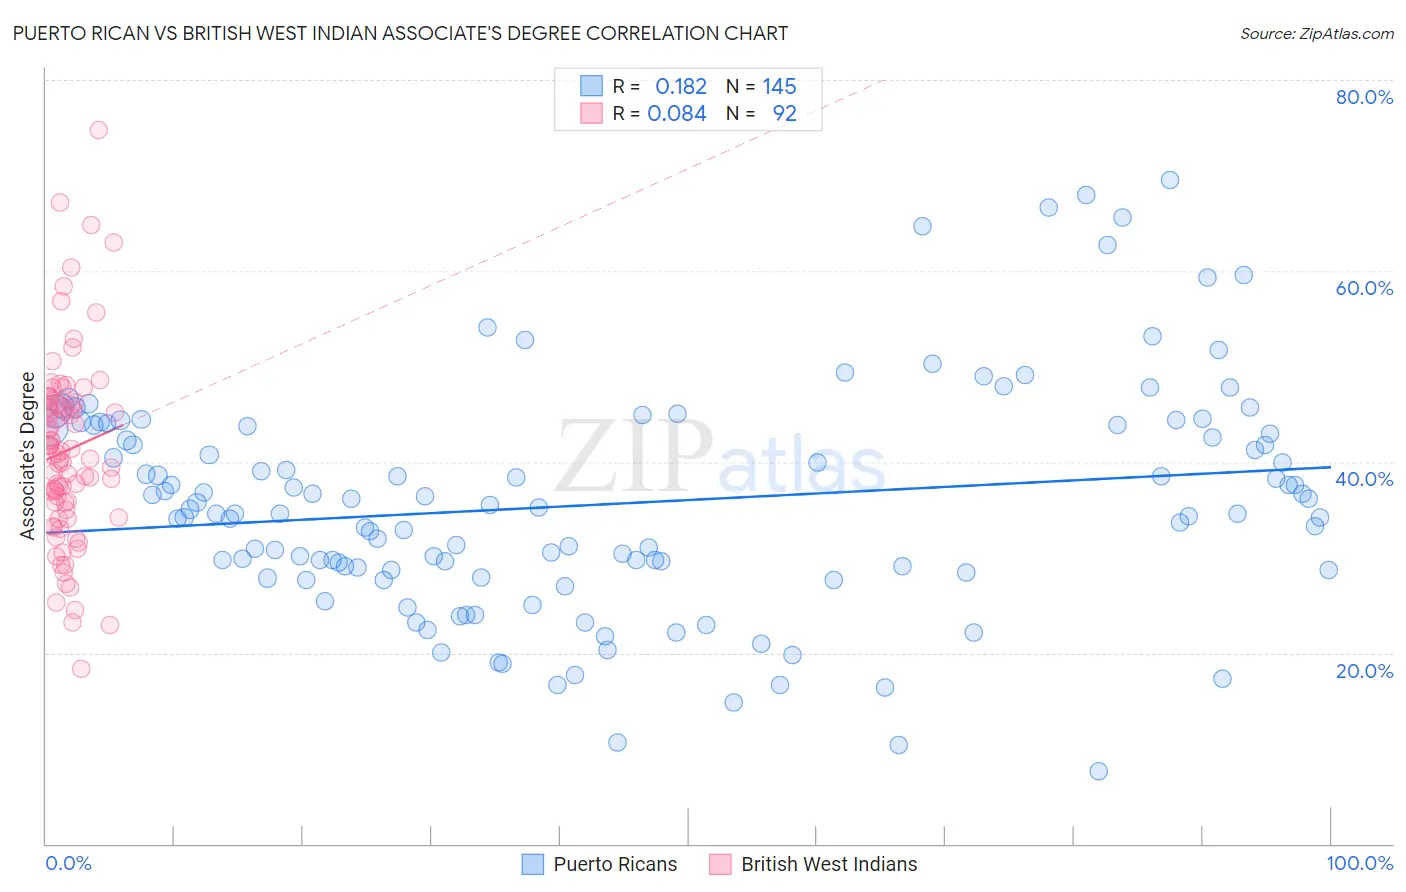
Puerto Rican vs British West Indian Associate's Degree Correlation Chart
The statistical analysis conducted on geographies consisting of 528,257,777 people shows a poor positive correlation between the proportion of Puerto Ricans and percentage of population with at least associate's degree education in the United States with a correlation coefficient (R) of 0.182 and weighted average of 40.4%. Similarly, the statistical analysis conducted on geographies consisting of 152,683,655 people shows a slight positive correlation between the proportion of British West Indians and percentage of population with at least associate's degree education in the United States with a correlation coefficient (R) of 0.084 and weighted average of 42.4%, a difference of 5.0%.
Associate's Degree Correlation Summary
| Measurement | Puerto Rican | British West Indian |
| Minimum | 7.5% | 18.3% |
| Maximum | 69.5% | 74.7% |
| Range | 61.9% | 56.4% |
| Mean | 35.6% | 41.2% |
| Median | 34.6% | 40.8% |
| Interquartile 25% (IQ1) | 28.7% | 35.3% |
| Interquartile 75% (IQ3) | 43.8% | 46.2% |
| Interquartile Range (IQR) | 15.1% | 10.9% |
| Standard Deviation (Sample) | 11.8% | 9.9% |
| Standard Deviation (Population) | 11.8% | 9.8% |
Similar Demographics by Associate's Degree
Demographics Similar to Puerto Ricans by Associate's Degree
In terms of associate's degree, the demographic groups most similar to Puerto Ricans are Blackfeet (40.3%, a difference of 0.050%), Potawatomi (40.4%, a difference of 0.10%), Ottawa (40.3%, a difference of 0.20%), Immigrants from Nicaragua (40.3%, a difference of 0.24%), and Immigrants from Dominica (40.5%, a difference of 0.25%).
| Demographics | Rating | Rank | Associate's Degree |
| Americans | 0.2 /100 | #269 | Tragic 40.8% |
| Chippewa | 0.2 /100 | #270 | Tragic 40.7% |
| Immigrants | Laos | 0.1 /100 | #271 | Tragic 40.7% |
| Belizeans | 0.1 /100 | #272 | Tragic 40.6% |
| Puget Sound Salish | 0.1 /100 | #273 | Tragic 40.5% |
| Immigrants | Dominica | 0.1 /100 | #274 | Tragic 40.5% |
| Potawatomi | 0.1 /100 | #275 | Tragic 40.4% |
| Puerto Ricans | 0.1 /100 | #276 | Tragic 40.4% |
| Blackfeet | 0.1 /100 | #277 | Tragic 40.3% |
| Ottawa | 0.1 /100 | #278 | Tragic 40.3% |
| Immigrants | Nicaragua | 0.1 /100 | #279 | Tragic 40.3% |
| Immigrants | Micronesia | 0.1 /100 | #280 | Tragic 40.2% |
| Immigrants | Portugal | 0.1 /100 | #281 | Tragic 40.1% |
| Bangladeshis | 0.1 /100 | #282 | Tragic 40.0% |
| Haitians | 0.1 /100 | #283 | Tragic 40.0% |
Demographics Similar to British West Indians by Associate's Degree
In terms of associate's degree, the demographic groups most similar to British West Indians are Immigrants from West Indies (42.4%, a difference of 0.010%), Guyanese (42.3%, a difference of 0.12%), Immigrants from Liberia (42.3%, a difference of 0.26%), Immigrants from Cambodia (42.3%, a difference of 0.28%), and Delaware (42.3%, a difference of 0.31%).
| Demographics | Rating | Rank | Associate's Degree |
| Tlingit-Haida | 2.1 /100 | #234 | Tragic 43.0% |
| Ecuadorians | 2.0 /100 | #235 | Tragic 43.0% |
| Immigrants | St. Vincent and the Grenadines | 1.9 /100 | #236 | Tragic 42.9% |
| Immigrants | Nonimmigrants | 1.9 /100 | #237 | Tragic 42.9% |
| Iroquois | 1.7 /100 | #238 | Tragic 42.8% |
| Immigrants | Grenada | 1.3 /100 | #239 | Tragic 42.6% |
| Cree | 1.2 /100 | #240 | Tragic 42.5% |
| British West Indians | 1.0 /100 | #241 | Tragic 42.4% |
| Immigrants | West Indies | 1.0 /100 | #242 | Tragic 42.4% |
| Guyanese | 1.0 /100 | #243 | Tragic 42.3% |
| Immigrants | Liberia | 0.9 /100 | #244 | Tragic 42.3% |
| Immigrants | Cambodia | 0.9 /100 | #245 | Tragic 42.3% |
| Delaware | 0.9 /100 | #246 | Tragic 42.3% |
| Immigrants | Fiji | 0.8 /100 | #247 | Tragic 42.2% |
| Immigrants | Ecuador | 0.8 /100 | #248 | Tragic 42.2% |