Pueblo vs Immigrants from Chile Median Male Earnings
COMPARE
Pueblo
Immigrants from Chile
Median Male Earnings
Median Male Earnings Comparison
Pueblo
Immigrants from Chile
$41,314
MEDIAN MALE EARNINGS
0.0/ 100
METRIC RATING
344th/ 347
METRIC RANK
$55,954
MEDIAN MALE EARNINGS
80.7/ 100
METRIC RATING
146th/ 347
METRIC RANK
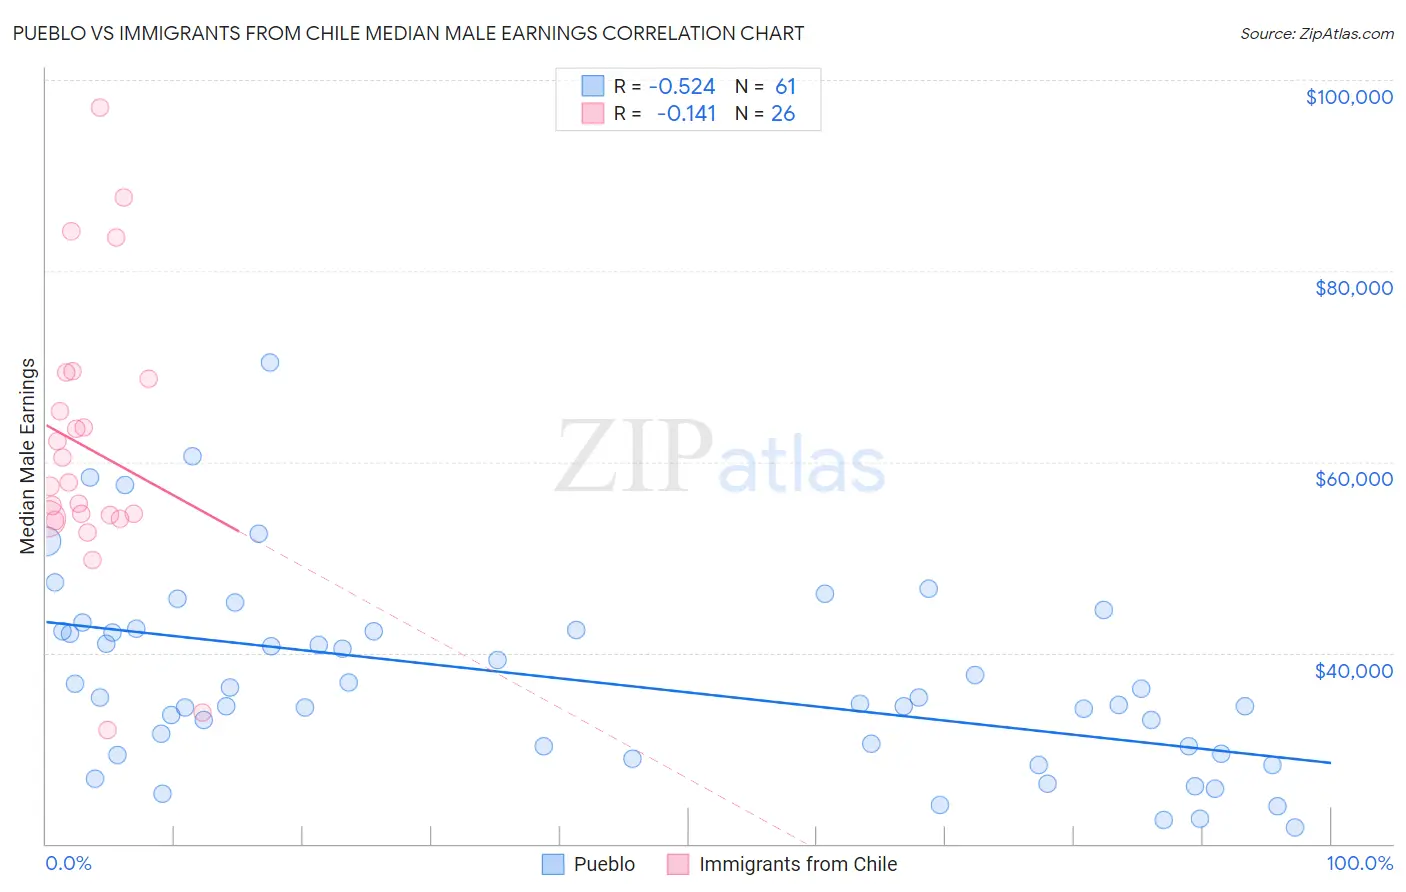
Pueblo vs Immigrants from Chile Median Male Earnings Correlation Chart
The statistical analysis conducted on geographies consisting of 120,058,056 people shows a substantial negative correlation between the proportion of Pueblo and median male earnings in the United States with a correlation coefficient (R) of -0.524 and weighted average of $41,314. Similarly, the statistical analysis conducted on geographies consisting of 218,627,915 people shows a poor negative correlation between the proportion of Immigrants from Chile and median male earnings in the United States with a correlation coefficient (R) of -0.141 and weighted average of $55,954, a difference of 35.4%.
Median Male Earnings Correlation Summary
| Measurement | Pueblo | Immigrants from Chile |
| Minimum | $21,750 | $31,923 |
| Maximum | $70,357 | $97,095 |
| Range | $48,607 | $65,172 |
| Mean | $37,142 | $61,352 |
| Median | $35,266 | $57,670 |
| Interquartile 25% (IQ1) | $29,777 | $54,075 |
| Interquartile 75% (IQ3) | $42,334 | $68,667 |
| Interquartile Range (IQR) | $12,557 | $14,592 |
| Standard Deviation (Sample) | $9,968 | $14,742 |
| Standard Deviation (Population) | $9,886 | $14,456 |
Similar Demographics by Median Male Earnings
Demographics Similar to Pueblo by Median Male Earnings
In terms of median male earnings, the demographic groups most similar to Pueblo are Lumbee ($41,715, a difference of 0.97%), Arapaho ($41,758, a difference of 1.1%), Hopi ($42,060, a difference of 1.8%), Navajo ($42,098, a difference of 1.9%), and Pima ($42,357, a difference of 2.5%).
| Demographics | Rating | Rank | Median Male Earnings |
| Immigrants | Congo | 0.0 /100 | #333 | Tragic $44,204 |
| Immigrants | Yemen | 0.0 /100 | #334 | Tragic $44,083 |
| Spanish American Indians | 0.0 /100 | #335 | Tragic $44,010 |
| Immigrants | Cuba | 0.0 /100 | #336 | Tragic $43,461 |
| Menominee | 0.0 /100 | #337 | Tragic $42,581 |
| Crow | 0.0 /100 | #338 | Tragic $42,434 |
| Pima | 0.0 /100 | #339 | Tragic $42,357 |
| Navajo | 0.0 /100 | #340 | Tragic $42,098 |
| Hopi | 0.0 /100 | #341 | Tragic $42,060 |
| Arapaho | 0.0 /100 | #342 | Tragic $41,758 |
| Lumbee | 0.0 /100 | #343 | Tragic $41,715 |
| Pueblo | 0.0 /100 | #344 | Tragic $41,314 |
| Puerto Ricans | 0.0 /100 | #345 | Tragic $40,071 |
| Tohono O'odham | 0.0 /100 | #346 | Tragic $39,543 |
| Yup'ik | 0.0 /100 | #347 | Tragic $39,504 |
Demographics Similar to Immigrants from Chile by Median Male Earnings
In terms of median male earnings, the demographic groups most similar to Immigrants from Chile are Norwegian ($55,965, a difference of 0.020%), Immigrants from Uganda ($56,064, a difference of 0.20%), Immigrants from Philippines ($55,809, a difference of 0.26%), Scottish ($55,793, a difference of 0.29%), and Sri Lankan ($56,136, a difference of 0.33%).
| Demographics | Rating | Rank | Median Male Earnings |
| Zimbabweans | 85.5 /100 | #139 | Excellent $56,302 |
| Luxembourgers | 85.5 /100 | #140 | Excellent $56,300 |
| Danes | 84.8 /100 | #141 | Excellent $56,246 |
| Ethiopians | 84.8 /100 | #142 | Excellent $56,243 |
| Sri Lankans | 83.4 /100 | #143 | Excellent $56,136 |
| Immigrants | Uganda | 82.4 /100 | #144 | Excellent $56,064 |
| Norwegians | 80.9 /100 | #145 | Excellent $55,965 |
| Immigrants | Chile | 80.7 /100 | #146 | Excellent $55,954 |
| Immigrants | Philippines | 78.4 /100 | #147 | Good $55,809 |
| Scottish | 78.2 /100 | #148 | Good $55,793 |
| English | 77.4 /100 | #149 | Good $55,747 |
| Swiss | 77.1 /100 | #150 | Good $55,731 |
| Immigrants | Oceania | 76.8 /100 | #151 | Good $55,712 |
| Peruvians | 75.8 /100 | #152 | Good $55,659 |
| Immigrants | Nepal | 75.0 /100 | #153 | Good $55,615 |