Pueblo vs Japanese Median Male Earnings
COMPARE
Pueblo
Japanese
Median Male Earnings
Median Male Earnings Comparison
Pueblo
Japanese
$41,314
MEDIAN MALE EARNINGS
0.0/ 100
METRIC RATING
344th/ 347
METRIC RANK
$51,473
MEDIAN MALE EARNINGS
4.9/ 100
METRIC RATING
226th/ 347
METRIC RANK
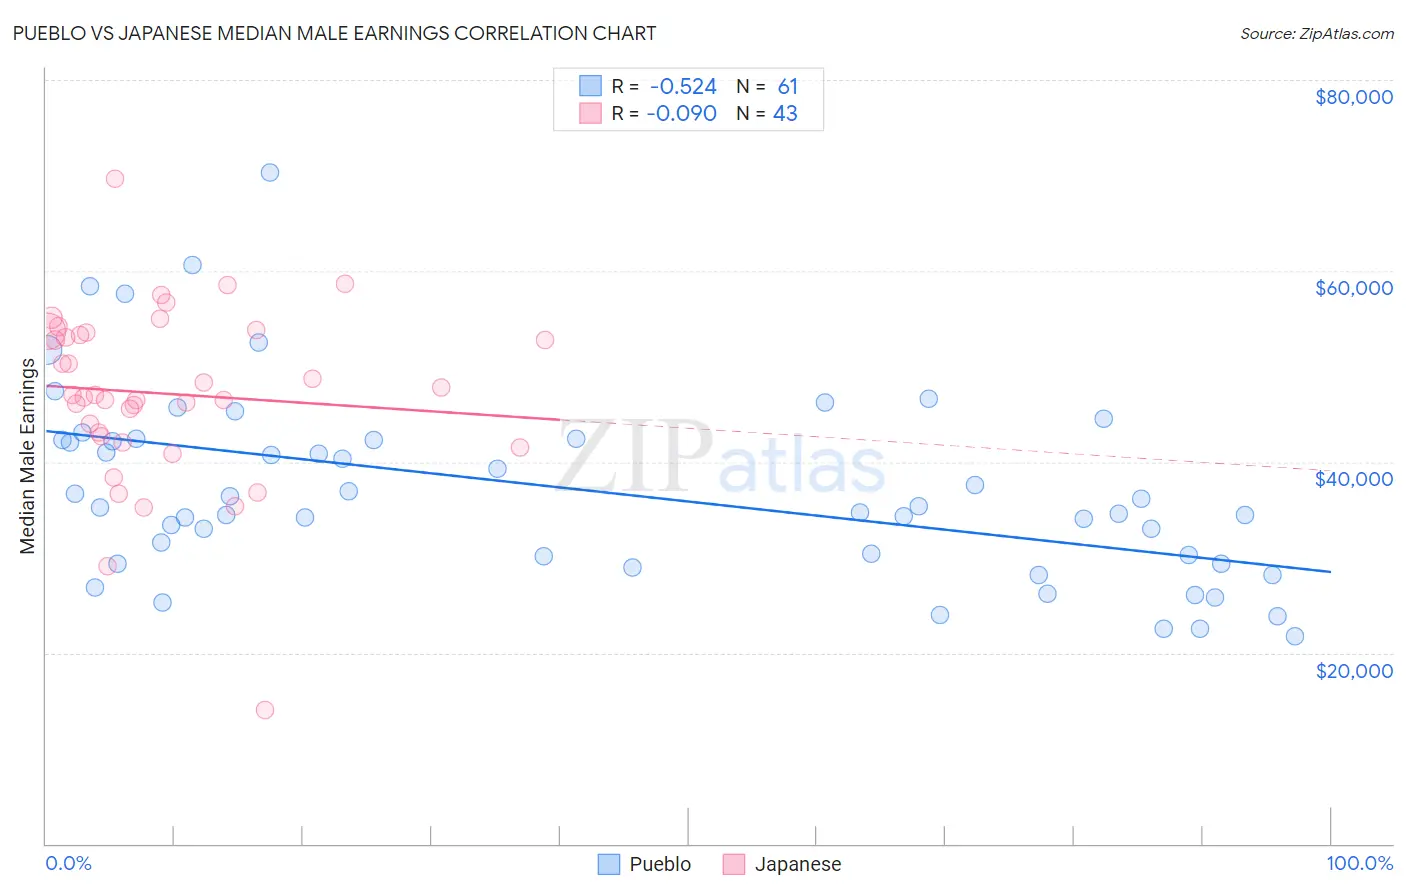
Pueblo vs Japanese Median Male Earnings Correlation Chart
The statistical analysis conducted on geographies consisting of 120,058,056 people shows a substantial negative correlation between the proportion of Pueblo and median male earnings in the United States with a correlation coefficient (R) of -0.524 and weighted average of $41,314. Similarly, the statistical analysis conducted on geographies consisting of 249,157,630 people shows a slight negative correlation between the proportion of Japanese and median male earnings in the United States with a correlation coefficient (R) of -0.090 and weighted average of $51,473, a difference of 24.6%.
Median Male Earnings Correlation Summary
| Measurement | Pueblo | Japanese |
| Minimum | $21,750 | $14,032 |
| Maximum | $70,357 | $69,626 |
| Range | $48,607 | $55,594 |
| Mean | $37,142 | $47,153 |
| Median | $35,266 | $47,032 |
| Interquartile 25% (IQ1) | $29,777 | $42,663 |
| Interquartile 75% (IQ3) | $42,334 | $53,598 |
| Interquartile Range (IQR) | $12,557 | $10,935 |
| Standard Deviation (Sample) | $9,968 | $9,237 |
| Standard Deviation (Population) | $9,886 | $9,129 |
Similar Demographics by Median Male Earnings
Demographics Similar to Pueblo by Median Male Earnings
In terms of median male earnings, the demographic groups most similar to Pueblo are Lumbee ($41,715, a difference of 0.97%), Arapaho ($41,758, a difference of 1.1%), Hopi ($42,060, a difference of 1.8%), Navajo ($42,098, a difference of 1.9%), and Pima ($42,357, a difference of 2.5%).
| Demographics | Rating | Rank | Median Male Earnings |
| Immigrants | Congo | 0.0 /100 | #333 | Tragic $44,204 |
| Immigrants | Yemen | 0.0 /100 | #334 | Tragic $44,083 |
| Spanish American Indians | 0.0 /100 | #335 | Tragic $44,010 |
| Immigrants | Cuba | 0.0 /100 | #336 | Tragic $43,461 |
| Menominee | 0.0 /100 | #337 | Tragic $42,581 |
| Crow | 0.0 /100 | #338 | Tragic $42,434 |
| Pima | 0.0 /100 | #339 | Tragic $42,357 |
| Navajo | 0.0 /100 | #340 | Tragic $42,098 |
| Hopi | 0.0 /100 | #341 | Tragic $42,060 |
| Arapaho | 0.0 /100 | #342 | Tragic $41,758 |
| Lumbee | 0.0 /100 | #343 | Tragic $41,715 |
| Pueblo | 0.0 /100 | #344 | Tragic $41,314 |
| Puerto Ricans | 0.0 /100 | #345 | Tragic $40,071 |
| Tohono O'odham | 0.0 /100 | #346 | Tragic $39,543 |
| Yup'ik | 0.0 /100 | #347 | Tragic $39,504 |
Demographics Similar to Japanese by Median Male Earnings
In terms of median male earnings, the demographic groups most similar to Japanese are Immigrants from Sudan ($51,489, a difference of 0.030%), Trinidadian and Tobagonian ($51,446, a difference of 0.050%), Samoan ($51,389, a difference of 0.16%), Immigrants from Trinidad and Tobago ($51,376, a difference of 0.19%), and Immigrants from Cambodia ($51,594, a difference of 0.23%).
| Demographics | Rating | Rank | Median Male Earnings |
| Immigrants | Ghana | 6.9 /100 | #219 | Tragic $51,836 |
| Immigrants | Armenia | 6.6 /100 | #220 | Tragic $51,793 |
| Immigrants | Senegal | 5.8 /100 | #221 | Tragic $51,647 |
| Immigrants | Bangladesh | 5.8 /100 | #222 | Tragic $51,642 |
| Ecuadorians | 5.5 /100 | #223 | Tragic $51,596 |
| Immigrants | Cambodia | 5.5 /100 | #224 | Tragic $51,594 |
| Immigrants | Sudan | 5.0 /100 | #225 | Tragic $51,489 |
| Japanese | 4.9 /100 | #226 | Tragic $51,473 |
| Trinidadians and Tobagonians | 4.8 /100 | #227 | Tragic $51,446 |
| Samoans | 4.6 /100 | #228 | Tragic $51,389 |
| Immigrants | Trinidad and Tobago | 4.5 /100 | #229 | Tragic $51,376 |
| Immigrants | Nigeria | 4.2 /100 | #230 | Tragic $51,310 |
| Barbadians | 3.9 /100 | #231 | Tragic $51,236 |
| Sudanese | 3.9 /100 | #232 | Tragic $51,216 |
| Aleuts | 3.7 /100 | #233 | Tragic $51,168 |