Vietnamese vs Korean Householder Income Ages 25 - 44 years
COMPARE
Vietnamese
Korean
Householder Income Ages 25 - 44 years
Householder Income Ages 25 - 44 years Comparison
Vietnamese
Koreans
$92,089
HOUSEHOLDER INCOME AGES 25 - 44 YEARS
20.2/ 100
METRIC RATING
198th/ 347
METRIC RANK
$103,824
HOUSEHOLDER INCOME AGES 25 - 44 YEARS
99.4/ 100
METRIC RATING
75th/ 347
METRIC RANK
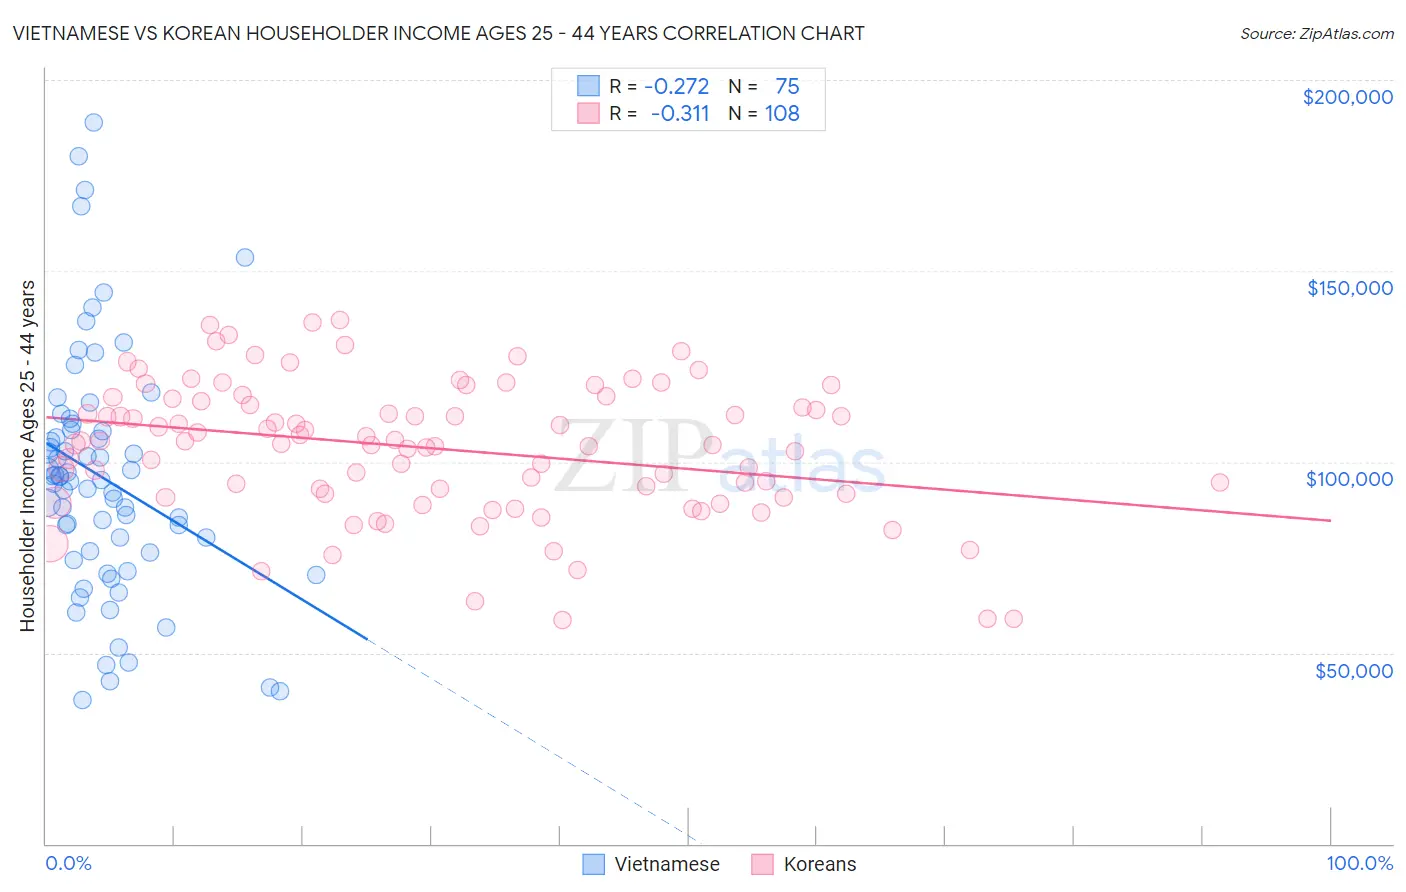
Vietnamese vs Korean Householder Income Ages 25 - 44 years Correlation Chart
The statistical analysis conducted on geographies consisting of 170,555,303 people shows a weak negative correlation between the proportion of Vietnamese and household income with householder between the ages 25 and 44 in the United States with a correlation coefficient (R) of -0.272 and weighted average of $92,089. Similarly, the statistical analysis conducted on geographies consisting of 508,598,360 people shows a mild negative correlation between the proportion of Koreans and household income with householder between the ages 25 and 44 in the United States with a correlation coefficient (R) of -0.311 and weighted average of $103,824, a difference of 12.7%.
Householder Income Ages 25 - 44 years Correlation Summary
| Measurement | Vietnamese | Korean |
| Minimum | $37,508 | $58,683 |
| Maximum | $188,772 | $137,023 |
| Range | $151,264 | $78,340 |
| Mean | $95,810 | $103,567 |
| Median | $95,390 | $105,054 |
| Interquartile 25% (IQ1) | $76,300 | $91,700 |
| Interquartile 75% (IQ3) | $108,353 | $116,277 |
| Interquartile Range (IQR) | $32,053 | $24,577 |
| Standard Deviation (Sample) | $31,666 | $17,535 |
| Standard Deviation (Population) | $31,454 | $17,454 |
Similar Demographics by Householder Income Ages 25 - 44 years
Demographics Similar to Vietnamese by Householder Income Ages 25 - 44 years
In terms of householder income ages 25 - 44 years, the demographic groups most similar to Vietnamese are Immigrants from Colombia ($92,204, a difference of 0.12%), Spanish ($92,200, a difference of 0.12%), Celtic ($92,241, a difference of 0.16%), Immigrants from the Azores ($92,322, a difference of 0.25%), and Samoan ($92,385, a difference of 0.32%).
| Demographics | Rating | Rank | Householder Income Ages 25 - 44 years |
| Tlingit-Haida | 29.4 /100 | #191 | Fair $92,987 |
| Immigrants | Costa Rica | 28.2 /100 | #192 | Fair $92,876 |
| Samoans | 23.0 /100 | #193 | Fair $92,385 |
| Immigrants | Azores | 22.4 /100 | #194 | Fair $92,322 |
| Celtics | 21.6 /100 | #195 | Fair $92,241 |
| Immigrants | Colombia | 21.3 /100 | #196 | Fair $92,204 |
| Spanish | 21.2 /100 | #197 | Fair $92,200 |
| Vietnamese | 20.2 /100 | #198 | Fair $92,089 |
| Kenyans | 16.8 /100 | #199 | Poor $91,684 |
| Whites/Caucasians | 16.7 /100 | #200 | Poor $91,668 |
| Japanese | 16.4 /100 | #201 | Poor $91,624 |
| Ecuadorians | 16.0 /100 | #202 | Poor $91,574 |
| Immigrants | Cambodia | 15.7 /100 | #203 | Poor $91,533 |
| Nepalese | 15.4 /100 | #204 | Poor $91,498 |
| Immigrants | Eastern Africa | 15.2 /100 | #205 | Poor $91,458 |
Demographics Similar to Koreans by Householder Income Ages 25 - 44 years
In terms of householder income ages 25 - 44 years, the demographic groups most similar to Koreans are Immigrants from Spain ($103,752, a difference of 0.070%), Immigrants from Fiji ($103,954, a difference of 0.13%), Immigrants from Southern Europe ($103,486, a difference of 0.33%), Italian ($104,215, a difference of 0.38%), and Immigrants from Bulgaria ($103,423, a difference of 0.39%).
| Demographics | Rating | Rank | Householder Income Ages 25 - 44 years |
| Immigrants | Eastern Europe | 99.6 /100 | #68 | Exceptional $104,662 |
| Mongolians | 99.6 /100 | #69 | Exceptional $104,578 |
| Immigrants | Croatia | 99.6 /100 | #70 | Exceptional $104,503 |
| Afghans | 99.6 /100 | #71 | Exceptional $104,410 |
| Chinese | 99.5 /100 | #72 | Exceptional $104,264 |
| Italians | 99.5 /100 | #73 | Exceptional $104,215 |
| Immigrants | Fiji | 99.5 /100 | #74 | Exceptional $103,954 |
| Koreans | 99.4 /100 | #75 | Exceptional $103,824 |
| Immigrants | Spain | 99.4 /100 | #76 | Exceptional $103,752 |
| Immigrants | Southern Europe | 99.3 /100 | #77 | Exceptional $103,486 |
| Immigrants | Bulgaria | 99.3 /100 | #78 | Exceptional $103,423 |
| Armenians | 99.2 /100 | #79 | Exceptional $103,248 |
| Immigrants | Egypt | 99.2 /100 | #80 | Exceptional $103,192 |
| South Africans | 99.2 /100 | #81 | Exceptional $103,160 |
| Immigrants | Serbia | 99.2 /100 | #82 | Exceptional $103,155 |