Immigrants from Western Europe vs Korean Householder Income Ages 25 - 44 years
COMPARE
Immigrants from Western Europe
Korean
Householder Income Ages 25 - 44 years
Householder Income Ages 25 - 44 years Comparison
Immigrants from Western Europe
Koreans
$102,654
HOUSEHOLDER INCOME AGES 25 - 44 YEARS
98.9/ 100
METRIC RATING
87th/ 347
METRIC RANK
$103,824
HOUSEHOLDER INCOME AGES 25 - 44 YEARS
99.4/ 100
METRIC RATING
75th/ 347
METRIC RANK
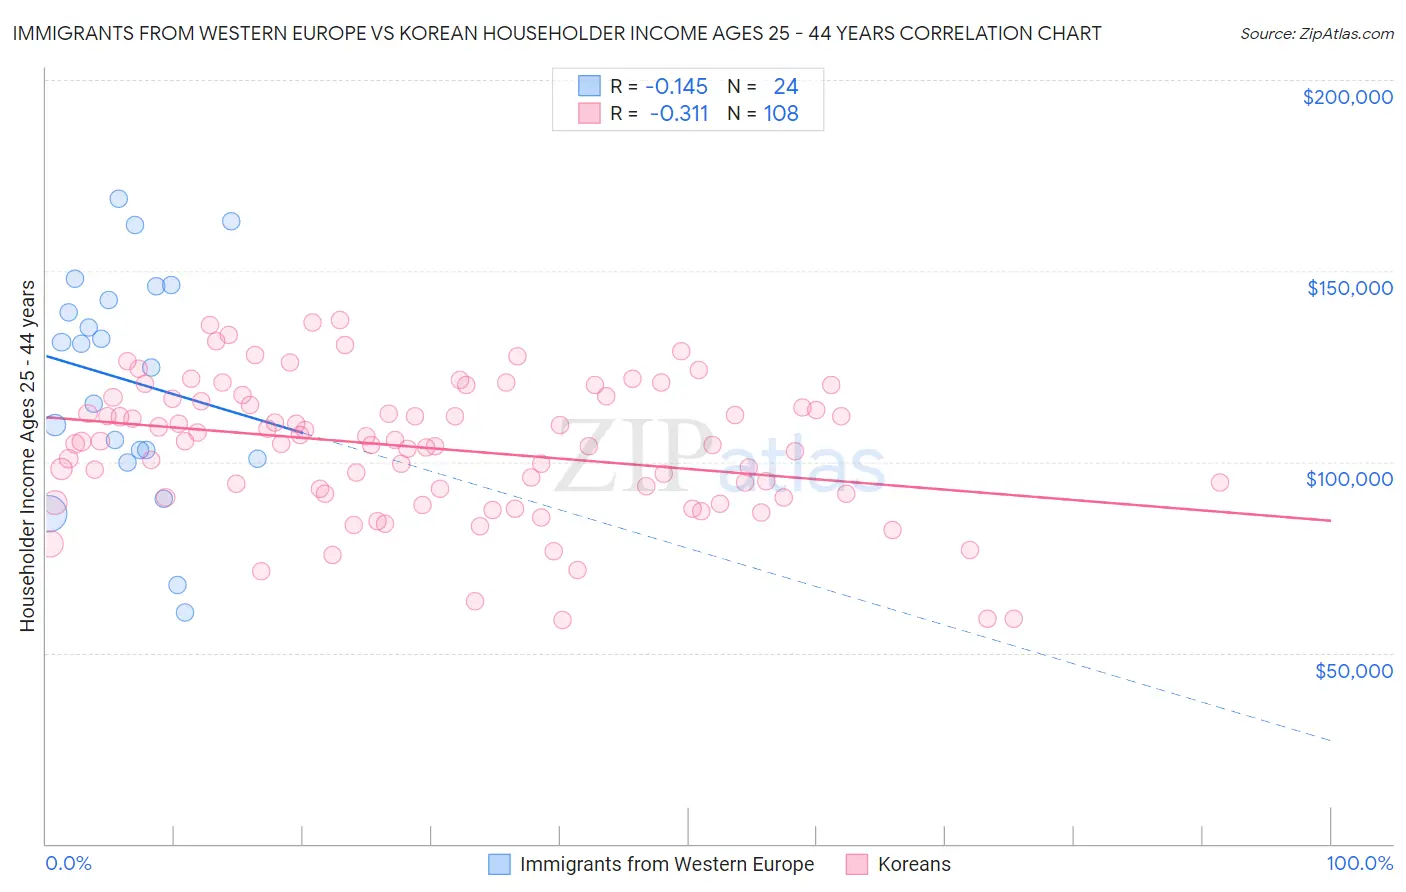
Immigrants from Western Europe vs Korean Householder Income Ages 25 - 44 years Correlation Chart
The statistical analysis conducted on geographies consisting of 491,977,269 people shows a poor negative correlation between the proportion of Immigrants from Western Europe and household income with householder between the ages 25 and 44 in the United States with a correlation coefficient (R) of -0.145 and weighted average of $102,654. Similarly, the statistical analysis conducted on geographies consisting of 508,598,360 people shows a mild negative correlation between the proportion of Koreans and household income with householder between the ages 25 and 44 in the United States with a correlation coefficient (R) of -0.311 and weighted average of $103,824, a difference of 1.1%.
Householder Income Ages 25 - 44 years Correlation Summary
| Measurement | Immigrants from Western Europe | Korean |
| Minimum | $60,664 | $58,683 |
| Maximum | $169,009 | $137,023 |
| Range | $108,344 | $78,340 |
| Mean | $121,344 | $103,567 |
| Median | $127,790 | $105,054 |
| Interquartile 25% (IQ1) | $101,950 | $91,700 |
| Interquartile 75% (IQ3) | $144,131 | $116,277 |
| Interquartile Range (IQR) | $42,181 | $24,577 |
| Standard Deviation (Sample) | $29,174 | $17,535 |
| Standard Deviation (Population) | $28,560 | $17,454 |
Demographics Similar to Immigrants from Western Europe and Koreans by Householder Income Ages 25 - 44 years
In terms of householder income ages 25 - 44 years, the demographic groups most similar to Immigrants from Western Europe are Immigrants from Hungary ($102,655, a difference of 0.0%), Immigrants from Ukraine ($102,664, a difference of 0.010%), Immigrants from Canada ($102,616, a difference of 0.040%), Romanian ($102,544, a difference of 0.11%), and Ukrainian ($102,451, a difference of 0.20%). Similarly, the demographic groups most similar to Koreans are Immigrants from Spain ($103,752, a difference of 0.070%), Immigrants from Fiji ($103,954, a difference of 0.13%), Immigrants from Southern Europe ($103,486, a difference of 0.33%), Italian ($104,215, a difference of 0.38%), and Immigrants from Bulgaria ($103,423, a difference of 0.39%).
| Demographics | Rating | Rank | Householder Income Ages 25 - 44 years |
| Afghans | 99.6 /100 | #71 | Exceptional $104,410 |
| Chinese | 99.5 /100 | #72 | Exceptional $104,264 |
| Italians | 99.5 /100 | #73 | Exceptional $104,215 |
| Immigrants | Fiji | 99.5 /100 | #74 | Exceptional $103,954 |
| Koreans | 99.4 /100 | #75 | Exceptional $103,824 |
| Immigrants | Spain | 99.4 /100 | #76 | Exceptional $103,752 |
| Immigrants | Southern Europe | 99.3 /100 | #77 | Exceptional $103,486 |
| Immigrants | Bulgaria | 99.3 /100 | #78 | Exceptional $103,423 |
| Armenians | 99.2 /100 | #79 | Exceptional $103,248 |
| Immigrants | Egypt | 99.2 /100 | #80 | Exceptional $103,192 |
| South Africans | 99.2 /100 | #81 | Exceptional $103,160 |
| Immigrants | Serbia | 99.2 /100 | #82 | Exceptional $103,155 |
| Argentineans | 99.1 /100 | #83 | Exceptional $103,111 |
| Immigrants | Philippines | 99.0 /100 | #84 | Exceptional $102,910 |
| Immigrants | Ukraine | 98.9 /100 | #85 | Exceptional $102,664 |
| Immigrants | Hungary | 98.9 /100 | #86 | Exceptional $102,655 |
| Immigrants | Western Europe | 98.9 /100 | #87 | Exceptional $102,654 |
| Immigrants | Canada | 98.9 /100 | #88 | Exceptional $102,616 |
| Romanians | 98.8 /100 | #89 | Exceptional $102,544 |
| Ukrainians | 98.8 /100 | #90 | Exceptional $102,451 |
| Croatians | 98.7 /100 | #91 | Exceptional $102,414 |