Potawatomi vs Immigrants from Sweden Median Earnings
COMPARE
Potawatomi
Immigrants from Sweden
Median Earnings
Median Earnings Comparison
Potawatomi
Immigrants from Sweden
$41,288
MEDIAN EARNINGS
0.1/ 100
METRIC RATING
294th/ 347
METRIC RANK
$54,478
MEDIAN EARNINGS
100.0/ 100
METRIC RATING
23rd/ 347
METRIC RANK
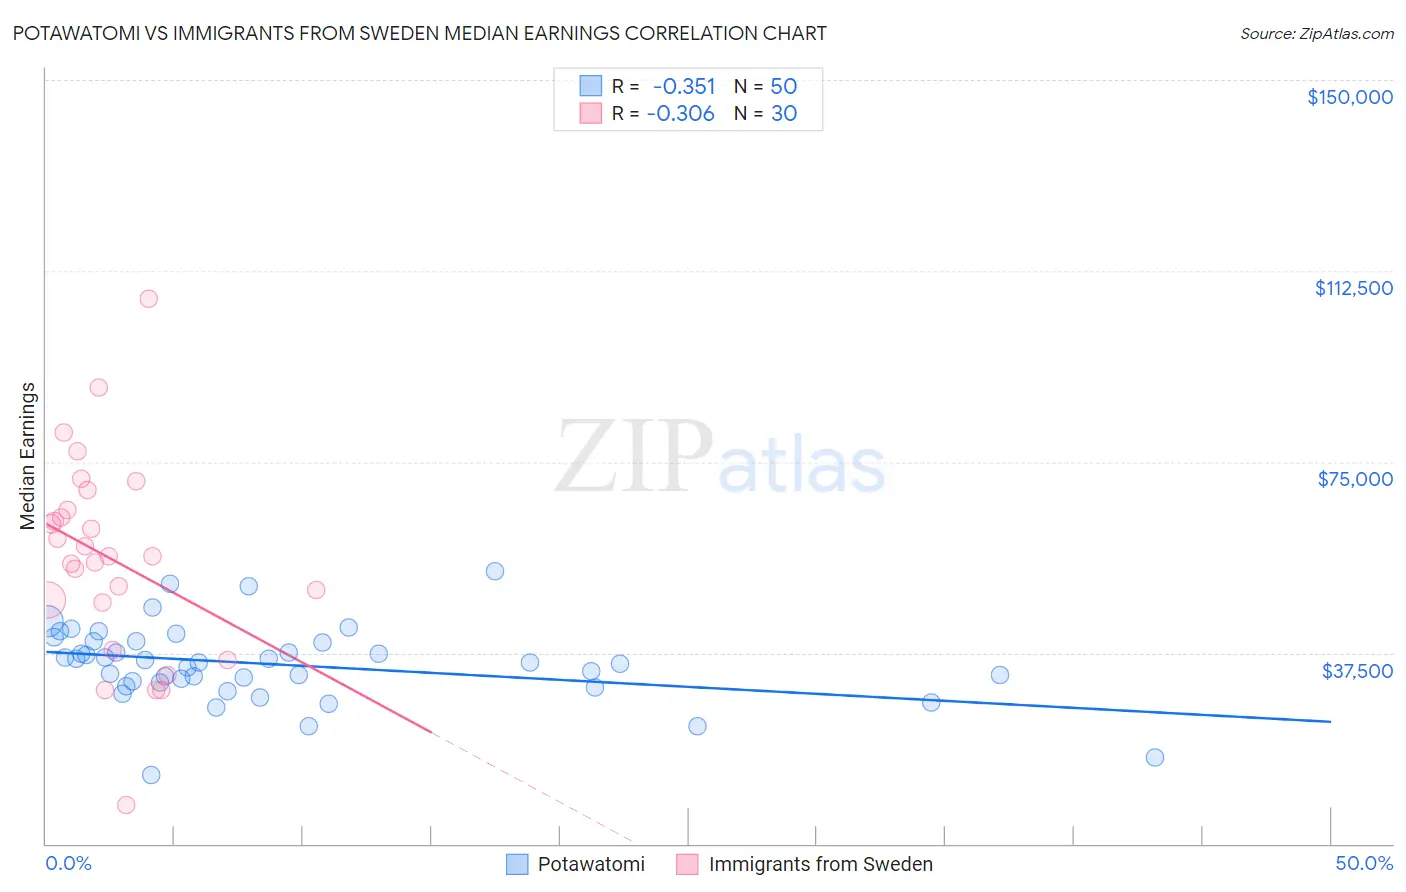
Potawatomi vs Immigrants from Sweden Median Earnings Correlation Chart
The statistical analysis conducted on geographies consisting of 117,770,629 people shows a mild negative correlation between the proportion of Potawatomi and median earnings in the United States with a correlation coefficient (R) of -0.351 and weighted average of $41,288. Similarly, the statistical analysis conducted on geographies consisting of 164,745,494 people shows a mild negative correlation between the proportion of Immigrants from Sweden and median earnings in the United States with a correlation coefficient (R) of -0.306 and weighted average of $54,478, a difference of 32.0%.
Median Earnings Correlation Summary
| Measurement | Potawatomi | Immigrants from Sweden |
| Minimum | $13,611 | $7,643 |
| Maximum | $53,523 | $106,979 |
| Range | $39,912 | $99,336 |
| Mean | $35,226 | $56,044 |
| Median | $35,630 | $56,394 |
| Interquartile 25% (IQ1) | $31,586 | $47,341 |
| Interquartile 75% (IQ3) | $39,871 | $65,578 |
| Interquartile Range (IQR) | $8,285 | $18,237 |
| Standard Deviation (Sample) | $7,629 | $19,951 |
| Standard Deviation (Population) | $7,552 | $19,616 |
Similar Demographics by Median Earnings
Demographics Similar to Potawatomi by Median Earnings
In terms of median earnings, the demographic groups most similar to Potawatomi are Bangladeshi ($41,263, a difference of 0.060%), Immigrants from Zaire ($41,325, a difference of 0.090%), Cherokee ($41,252, a difference of 0.090%), Guatemalan ($41,205, a difference of 0.20%), and Immigrants from Micronesia ($41,133, a difference of 0.38%).
| Demographics | Rating | Rank | Median Earnings |
| Indonesians | 0.1 /100 | #287 | Tragic $41,701 |
| Immigrants | Dominican Republic | 0.1 /100 | #288 | Tragic $41,554 |
| Comanche | 0.1 /100 | #289 | Tragic $41,519 |
| Paiute | 0.1 /100 | #290 | Tragic $41,508 |
| Central American Indians | 0.1 /100 | #291 | Tragic $41,474 |
| U.S. Virgin Islanders | 0.1 /100 | #292 | Tragic $41,448 |
| Immigrants | Zaire | 0.1 /100 | #293 | Tragic $41,325 |
| Potawatomi | 0.1 /100 | #294 | Tragic $41,288 |
| Bangladeshis | 0.1 /100 | #295 | Tragic $41,263 |
| Cherokee | 0.1 /100 | #296 | Tragic $41,252 |
| Guatemalans | 0.1 /100 | #297 | Tragic $41,205 |
| Immigrants | Micronesia | 0.1 /100 | #298 | Tragic $41,133 |
| Immigrants | Caribbean | 0.1 /100 | #299 | Tragic $41,119 |
| Ute | 0.1 /100 | #300 | Tragic $41,051 |
| Immigrants | Latin America | 0.1 /100 | #301 | Tragic $41,049 |
Demographics Similar to Immigrants from Sweden by Median Earnings
In terms of median earnings, the demographic groups most similar to Immigrants from Sweden are Immigrants from Korea ($54,530, a difference of 0.10%), Burmese ($54,559, a difference of 0.15%), Cypriot ($54,589, a difference of 0.20%), Soviet Union ($54,290, a difference of 0.35%), and Immigrants from Belgium ($54,679, a difference of 0.37%).
| Demographics | Rating | Rank | Median Earnings |
| Immigrants | Eastern Asia | 100.0 /100 | #16 | Exceptional $56,183 |
| Eastern Europeans | 100.0 /100 | #17 | Exceptional $55,084 |
| Immigrants | Japan | 100.0 /100 | #18 | Exceptional $54,938 |
| Immigrants | Belgium | 100.0 /100 | #19 | Exceptional $54,679 |
| Cypriots | 100.0 /100 | #20 | Exceptional $54,589 |
| Burmese | 100.0 /100 | #21 | Exceptional $54,559 |
| Immigrants | Korea | 100.0 /100 | #22 | Exceptional $54,530 |
| Immigrants | Sweden | 100.0 /100 | #23 | Exceptional $54,478 |
| Soviet Union | 100.0 /100 | #24 | Exceptional $54,290 |
| Turks | 100.0 /100 | #25 | Exceptional $53,919 |
| Immigrants | Northern Europe | 100.0 /100 | #26 | Exceptional $53,872 |
| Asians | 100.0 /100 | #27 | Exceptional $53,690 |
| Immigrants | France | 100.0 /100 | #28 | Exceptional $53,490 |
| Immigrants | Russia | 100.0 /100 | #29 | Exceptional $53,457 |
| Cambodians | 100.0 /100 | #30 | Exceptional $53,386 |