Chickasaw vs Immigrants from Russia Median Household Income
COMPARE
Chickasaw
Immigrants from Russia
Median Household Income
Median Household Income Comparison
Chickasaw
Immigrants from Russia
$70,005
MEDIAN HOUSEHOLD INCOME
0.0/ 100
METRIC RATING
321st/ 347
METRIC RANK
$96,378
MEDIAN HOUSEHOLD INCOME
99.9/ 100
METRIC RATING
47th/ 347
METRIC RANK
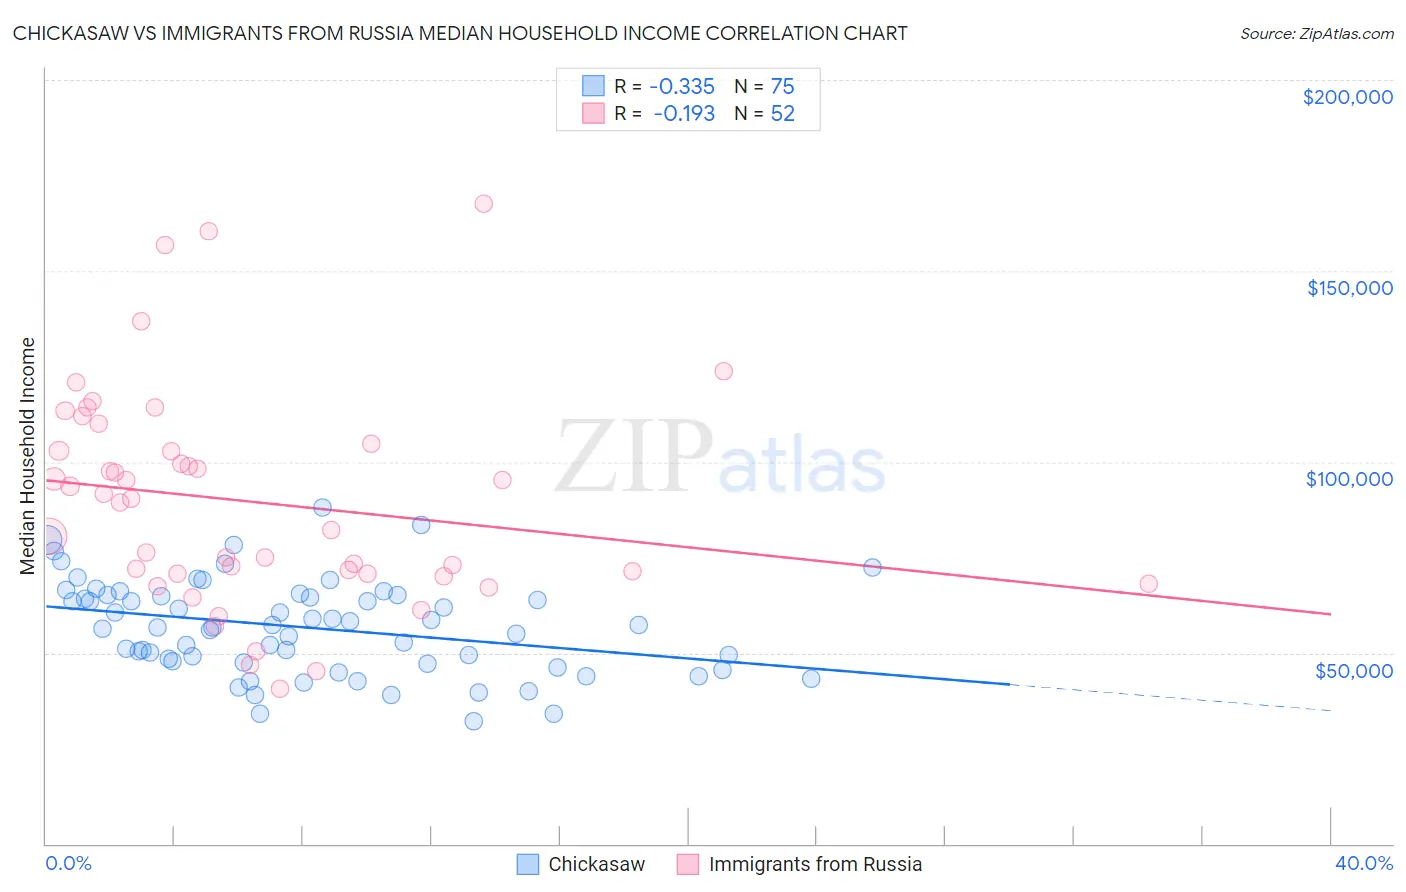
Chickasaw vs Immigrants from Russia Median Household Income Correlation Chart
The statistical analysis conducted on geographies consisting of 147,666,315 people shows a mild negative correlation between the proportion of Chickasaw and median household income in the United States with a correlation coefficient (R) of -0.335 and weighted average of $70,005. Similarly, the statistical analysis conducted on geographies consisting of 347,675,291 people shows a poor negative correlation between the proportion of Immigrants from Russia and median household income in the United States with a correlation coefficient (R) of -0.193 and weighted average of $96,378, a difference of 37.7%.
Median Household Income Correlation Summary
| Measurement | Chickasaw | Immigrants from Russia |
| Minimum | $32,063 | $40,467 |
| Maximum | $88,105 | $167,656 |
| Range | $56,042 | $127,189 |
| Mean | $56,625 | $89,609 |
| Median | $56,725 | $89,857 |
| Interquartile 25% (IQ1) | $47,447 | $70,618 |
| Interquartile 75% (IQ3) | $65,033 | $103,868 |
| Interquartile Range (IQR) | $17,586 | $33,250 |
| Standard Deviation (Sample) | $12,174 | $28,243 |
| Standard Deviation (Population) | $12,093 | $27,970 |
Similar Demographics by Median Household Income
Demographics Similar to Chickasaw by Median Household Income
In terms of median household income, the demographic groups most similar to Chickasaw are Choctaw ($69,947, a difference of 0.080%), Colville ($70,094, a difference of 0.13%), Immigrants from Dominican Republic ($70,208, a difference of 0.29%), Bahamian ($69,726, a difference of 0.40%), and Yup'ik ($69,695, a difference of 0.45%).
| Demographics | Rating | Rank | Median Household Income |
| Dominicans | 0.0 /100 | #314 | Tragic $71,302 |
| Ottawa | 0.0 /100 | #315 | Tragic $70,984 |
| Apache | 0.0 /100 | #316 | Tragic $70,927 |
| Cajuns | 0.0 /100 | #317 | Tragic $70,605 |
| Chippewa | 0.0 /100 | #318 | Tragic $70,539 |
| Immigrants | Dominican Republic | 0.0 /100 | #319 | Tragic $70,208 |
| Colville | 0.0 /100 | #320 | Tragic $70,094 |
| Chickasaw | 0.0 /100 | #321 | Tragic $70,005 |
| Choctaw | 0.0 /100 | #322 | Tragic $69,947 |
| Bahamians | 0.0 /100 | #323 | Tragic $69,726 |
| Yup'ik | 0.0 /100 | #324 | Tragic $69,695 |
| Seminole | 0.0 /100 | #325 | Tragic $69,420 |
| Yuman | 0.0 /100 | #326 | Tragic $68,743 |
| Immigrants | Cuba | 0.0 /100 | #327 | Tragic $68,461 |
| Menominee | 0.0 /100 | #328 | Tragic $68,423 |
Demographics Similar to Immigrants from Russia by Median Household Income
In terms of median household income, the demographic groups most similar to Immigrants from Russia are Cambodian ($96,324, a difference of 0.060%), Immigrants from Malaysia ($96,292, a difference of 0.090%), Bulgarian ($96,290, a difference of 0.090%), Australian ($96,490, a difference of 0.12%), and Israeli ($96,552, a difference of 0.18%).
| Demographics | Rating | Rank | Median Household Income |
| Maltese | 100.0 /100 | #40 | Exceptional $97,015 |
| Immigrants | Turkey | 100.0 /100 | #41 | Exceptional $96,964 |
| Immigrants | Lithuania | 99.9 /100 | #42 | Exceptional $96,836 |
| Immigrants | France | 99.9 /100 | #43 | Exceptional $96,743 |
| Immigrants | Greece | 99.9 /100 | #44 | Exceptional $96,675 |
| Israelis | 99.9 /100 | #45 | Exceptional $96,552 |
| Australians | 99.9 /100 | #46 | Exceptional $96,490 |
| Immigrants | Russia | 99.9 /100 | #47 | Exceptional $96,378 |
| Cambodians | 99.9 /100 | #48 | Exceptional $96,324 |
| Immigrants | Malaysia | 99.9 /100 | #49 | Exceptional $96,292 |
| Bulgarians | 99.9 /100 | #50 | Exceptional $96,290 |
| Estonians | 99.9 /100 | #51 | Exceptional $95,930 |
| Immigrants | South Africa | 99.9 /100 | #52 | Exceptional $95,800 |
| Paraguayans | 99.9 /100 | #53 | Exceptional $95,737 |
| Egyptians | 99.9 /100 | #54 | Exceptional $95,673 |