Mongolian vs Immigrants from Russia Median Household Income
COMPARE
Mongolian
Immigrants from Russia
Median Household Income
Median Household Income Comparison
Mongolians
Immigrants from Russia
$93,971
MEDIAN HOUSEHOLD INCOME
99.7/ 100
METRIC RATING
68th/ 347
METRIC RANK
$96,378
MEDIAN HOUSEHOLD INCOME
99.9/ 100
METRIC RATING
47th/ 347
METRIC RANK
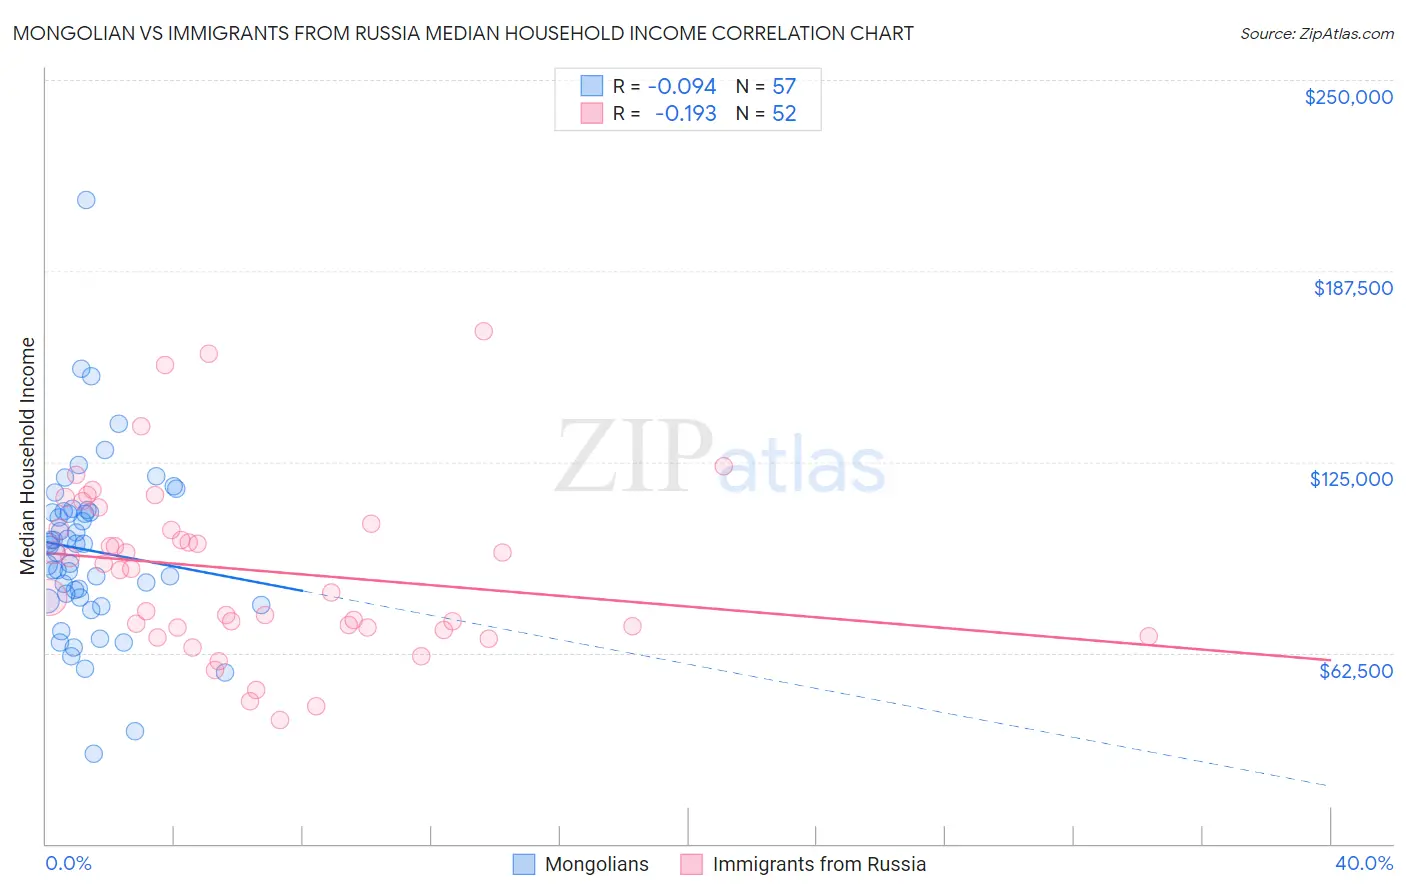
Mongolian vs Immigrants from Russia Median Household Income Correlation Chart
The statistical analysis conducted on geographies consisting of 140,276,403 people shows a slight negative correlation between the proportion of Mongolians and median household income in the United States with a correlation coefficient (R) of -0.094 and weighted average of $93,971. Similarly, the statistical analysis conducted on geographies consisting of 347,675,291 people shows a poor negative correlation between the proportion of Immigrants from Russia and median household income in the United States with a correlation coefficient (R) of -0.193 and weighted average of $96,378, a difference of 2.6%.
Median Household Income Correlation Summary
| Measurement | Mongolian | Immigrants from Russia |
| Minimum | $29,643 | $40,467 |
| Maximum | $210,785 | $167,656 |
| Range | $181,142 | $127,189 |
| Mean | $96,039 | $89,609 |
| Median | $97,648 | $89,857 |
| Interquartile 25% (IQ1) | $79,996 | $70,618 |
| Interquartile 75% (IQ3) | $108,680 | $103,868 |
| Interquartile Range (IQR) | $28,684 | $33,250 |
| Standard Deviation (Sample) | $28,830 | $28,243 |
| Standard Deviation (Population) | $28,576 | $27,970 |
Similar Demographics by Median Household Income
Demographics Similar to Mongolians by Median Household Income
In terms of median household income, the demographic groups most similar to Mongolians are Argentinean ($93,960, a difference of 0.010%), Immigrants from Fiji ($93,933, a difference of 0.040%), Immigrants from Philippines ($93,899, a difference of 0.080%), Immigrants from Scotland ($94,091, a difference of 0.13%), and Lithuanian ($93,852, a difference of 0.13%).
| Demographics | Rating | Rank | Median Household Income |
| Laotians | 99.8 /100 | #61 | Exceptional $94,990 |
| Immigrants | Norway | 99.8 /100 | #62 | Exceptional $94,846 |
| Greeks | 99.8 /100 | #63 | Exceptional $94,735 |
| Immigrants | Netherlands | 99.7 /100 | #64 | Exceptional $94,411 |
| Immigrants | Belarus | 99.7 /100 | #65 | Exceptional $94,399 |
| Immigrants | Romania | 99.7 /100 | #66 | Exceptional $94,222 |
| Immigrants | Scotland | 99.7 /100 | #67 | Exceptional $94,091 |
| Mongolians | 99.7 /100 | #68 | Exceptional $93,971 |
| Argentineans | 99.7 /100 | #69 | Exceptional $93,960 |
| Immigrants | Fiji | 99.7 /100 | #70 | Exceptional $93,933 |
| Immigrants | Philippines | 99.6 /100 | #71 | Exceptional $93,899 |
| Lithuanians | 99.6 /100 | #72 | Exceptional $93,852 |
| Immigrants | Egypt | 99.6 /100 | #73 | Exceptional $93,700 |
| Immigrants | Latvia | 99.6 /100 | #74 | Exceptional $93,602 |
| Immigrants | Italy | 99.5 /100 | #75 | Exceptional $93,465 |
Demographics Similar to Immigrants from Russia by Median Household Income
In terms of median household income, the demographic groups most similar to Immigrants from Russia are Cambodian ($96,324, a difference of 0.060%), Immigrants from Malaysia ($96,292, a difference of 0.090%), Bulgarian ($96,290, a difference of 0.090%), Australian ($96,490, a difference of 0.12%), and Israeli ($96,552, a difference of 0.18%).
| Demographics | Rating | Rank | Median Household Income |
| Maltese | 100.0 /100 | #40 | Exceptional $97,015 |
| Immigrants | Turkey | 100.0 /100 | #41 | Exceptional $96,964 |
| Immigrants | Lithuania | 99.9 /100 | #42 | Exceptional $96,836 |
| Immigrants | France | 99.9 /100 | #43 | Exceptional $96,743 |
| Immigrants | Greece | 99.9 /100 | #44 | Exceptional $96,675 |
| Israelis | 99.9 /100 | #45 | Exceptional $96,552 |
| Australians | 99.9 /100 | #46 | Exceptional $96,490 |
| Immigrants | Russia | 99.9 /100 | #47 | Exceptional $96,378 |
| Cambodians | 99.9 /100 | #48 | Exceptional $96,324 |
| Immigrants | Malaysia | 99.9 /100 | #49 | Exceptional $96,292 |
| Bulgarians | 99.9 /100 | #50 | Exceptional $96,290 |
| Estonians | 99.9 /100 | #51 | Exceptional $95,930 |
| Immigrants | South Africa | 99.9 /100 | #52 | Exceptional $95,800 |
| Paraguayans | 99.9 /100 | #53 | Exceptional $95,737 |
| Egyptians | 99.9 /100 | #54 | Exceptional $95,673 |