Portuguese vs South American Indian Bachelor's Degree
COMPARE
Portuguese
South American Indian
Bachelor's Degree
Bachelor's Degree Comparison
Portuguese
South American Indians
35.5%
BACHELOR'S DEGREE
7.2/ 100
METRIC RATING
226th/ 347
METRIC RANK
39.3%
BACHELOR'S DEGREE
83.6/ 100
METRIC RATING
141st/ 347
METRIC RANK
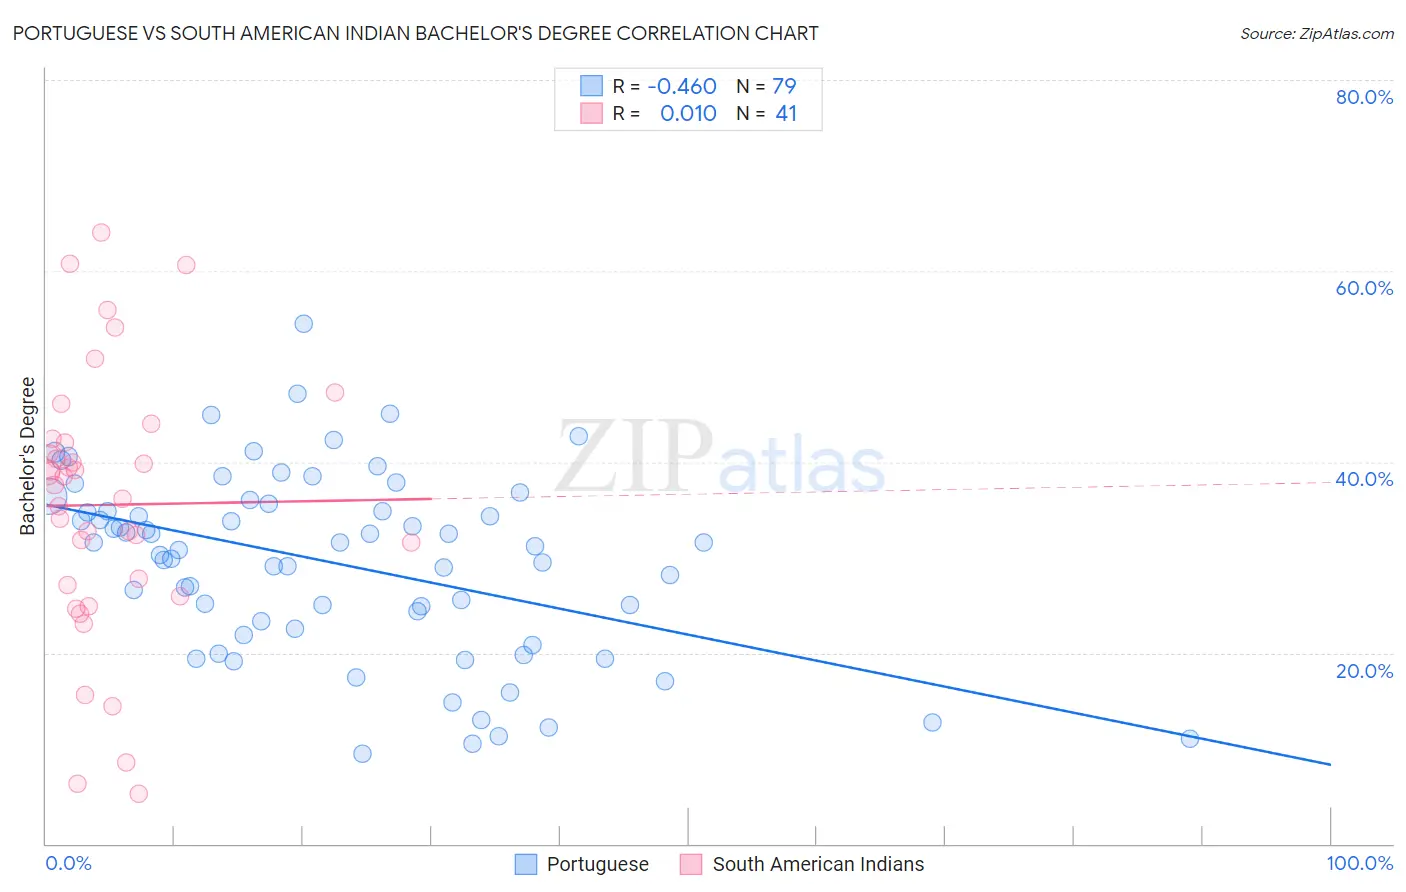
Portuguese vs South American Indian Bachelor's Degree Correlation Chart
The statistical analysis conducted on geographies consisting of 450,314,752 people shows a moderate negative correlation between the proportion of Portuguese and percentage of population with at least bachelor's degree education in the United States with a correlation coefficient (R) of -0.460 and weighted average of 35.5%. Similarly, the statistical analysis conducted on geographies consisting of 164,573,036 people shows no correlation between the proportion of South American Indians and percentage of population with at least bachelor's degree education in the United States with a correlation coefficient (R) of 0.010 and weighted average of 39.3%, a difference of 10.8%.
Bachelor's Degree Correlation Summary
| Measurement | Portuguese | South American Indian |
| Minimum | 9.4% | 5.3% |
| Maximum | 54.4% | 64.1% |
| Range | 45.0% | 58.8% |
| Mean | 29.4% | 35.5% |
| Median | 31.1% | 37.6% |
| Interquartile 25% (IQ1) | 22.5% | 26.5% |
| Interquartile 75% (IQ3) | 35.6% | 42.3% |
| Interquartile Range (IQR) | 13.1% | 15.8% |
| Standard Deviation (Sample) | 9.6% | 14.0% |
| Standard Deviation (Population) | 9.5% | 13.8% |
Similar Demographics by Bachelor's Degree
Demographics Similar to Portuguese by Bachelor's Degree
In terms of bachelor's degree, the demographic groups most similar to Portuguese are Immigrants from Burma/Myanmar (35.5%, a difference of 0.040%), Immigrants from Barbados (35.5%, a difference of 0.11%), Ecuadorian (35.4%, a difference of 0.26%), French Canadian (35.6%, a difference of 0.38%), and Immigrants from Trinidad and Tobago (35.3%, a difference of 0.49%).
| Demographics | Rating | Rank | Bachelor's Degree |
| West Indians | 9.7 /100 | #219 | Tragic 35.8% |
| Spanish | 9.6 /100 | #220 | Tragic 35.8% |
| Dutch | 9.2 /100 | #221 | Tragic 35.7% |
| Trinidadians and Tobagonians | 8.8 /100 | #222 | Tragic 35.7% |
| French Canadians | 8.3 /100 | #223 | Tragic 35.6% |
| Immigrants | Barbados | 7.5 /100 | #224 | Tragic 35.5% |
| Immigrants | Burma/Myanmar | 7.3 /100 | #225 | Tragic 35.5% |
| Portuguese | 7.2 /100 | #226 | Tragic 35.5% |
| Ecuadorians | 6.6 /100 | #227 | Tragic 35.4% |
| Immigrants | Trinidad and Tobago | 6.0 /100 | #228 | Tragic 35.3% |
| Whites/Caucasians | 5.9 /100 | #229 | Tragic 35.3% |
| Immigrants | Grenada | 4.3 /100 | #230 | Tragic 35.0% |
| Immigrants | St. Vincent and the Grenadines | 4.3 /100 | #231 | Tragic 35.0% |
| Hmong | 3.4 /100 | #232 | Tragic 34.8% |
| Immigrants | Ecuador | 3.3 /100 | #233 | Tragic 34.7% |
Demographics Similar to South American Indians by Bachelor's Degree
In terms of bachelor's degree, the demographic groups most similar to South American Indians are Immigrants from Armenia (39.4%, a difference of 0.090%), Immigrants from Sudan (39.4%, a difference of 0.16%), Immigrants from North Macedonia (39.2%, a difference of 0.32%), European (39.5%, a difference of 0.35%), and Icelander (39.5%, a difference of 0.53%).
| Demographics | Rating | Rank | Bachelor's Degree |
| Assyrians/Chaldeans/Syriacs | 89.4 /100 | #134 | Excellent 39.8% |
| Luxembourgers | 89.1 /100 | #135 | Excellent 39.8% |
| Pakistanis | 88.2 /100 | #136 | Excellent 39.7% |
| Icelanders | 86.5 /100 | #137 | Excellent 39.5% |
| Europeans | 85.6 /100 | #138 | Excellent 39.5% |
| Immigrants | Sudan | 84.5 /100 | #139 | Excellent 39.4% |
| Immigrants | Armenia | 84.1 /100 | #140 | Excellent 39.4% |
| South American Indians | 83.6 /100 | #141 | Excellent 39.3% |
| Immigrants | North Macedonia | 81.6 /100 | #142 | Excellent 39.2% |
| Poles | 79.8 /100 | #143 | Good 39.1% |
| Immigrants | Afghanistan | 79.7 /100 | #144 | Good 39.1% |
| Slovenes | 79.5 /100 | #145 | Good 39.1% |
| Swedes | 79.2 /100 | #146 | Good 39.1% |
| Immigrants | Sierra Leone | 79.0 /100 | #147 | Good 39.0% |
| Iraqis | 78.1 /100 | #148 | Good 39.0% |