Portuguese vs Sierra Leonean Median Male Earnings
COMPARE
Portuguese
Sierra Leonean
Median Male Earnings
Median Male Earnings Comparison
Portuguese
Sierra Leoneans
$56,663
MEDIAN MALE EARNINGS
89.4/ 100
METRIC RATING
131st/ 347
METRIC RANK
$54,279
MEDIAN MALE EARNINGS
44.8/ 100
METRIC RATING
178th/ 347
METRIC RANK
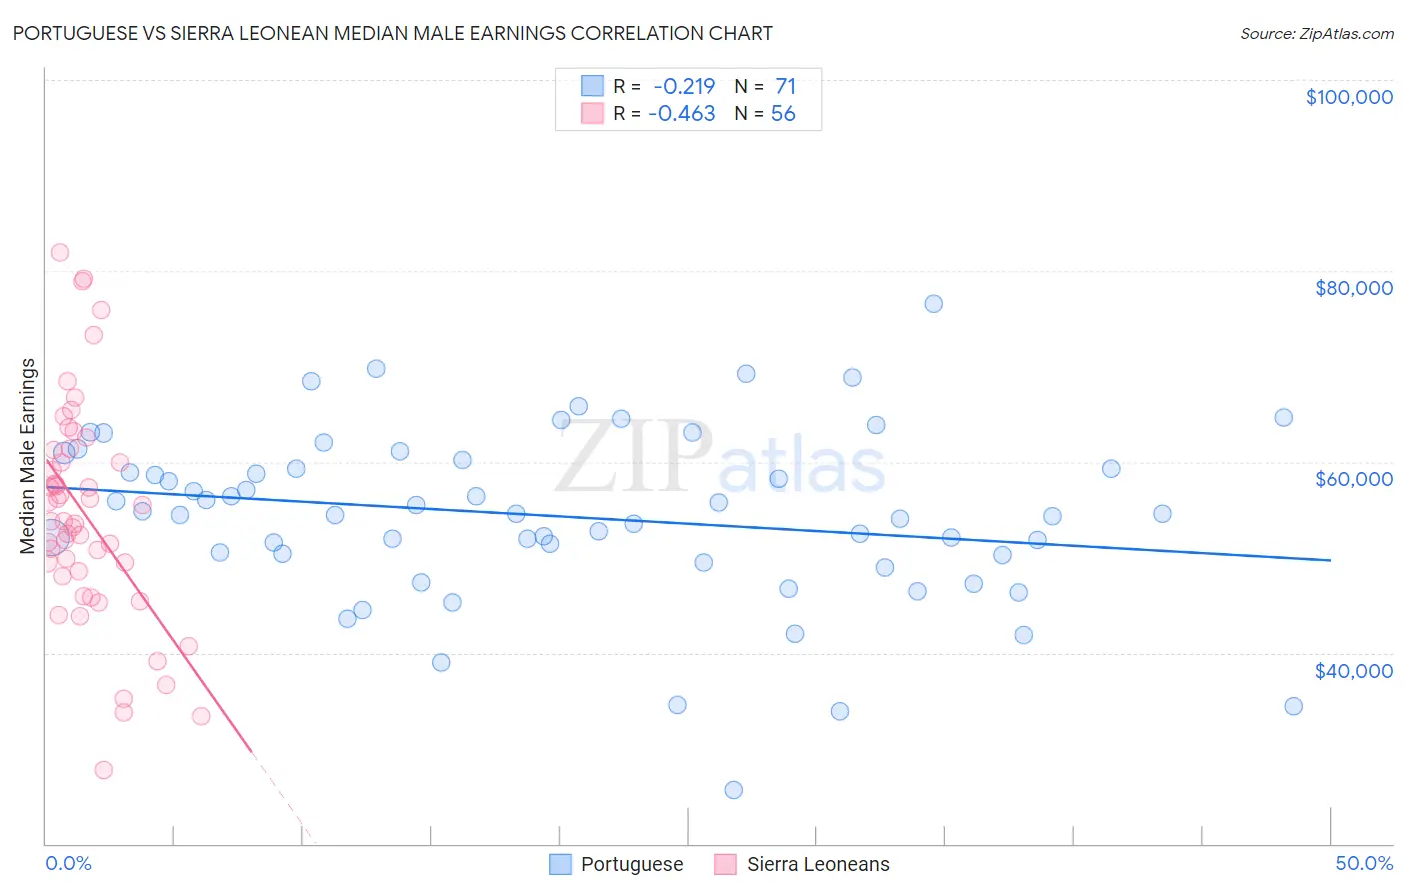
Portuguese vs Sierra Leonean Median Male Earnings Correlation Chart
The statistical analysis conducted on geographies consisting of 450,078,327 people shows a weak negative correlation between the proportion of Portuguese and median male earnings in the United States with a correlation coefficient (R) of -0.219 and weighted average of $56,663. Similarly, the statistical analysis conducted on geographies consisting of 83,343,819 people shows a moderate negative correlation between the proportion of Sierra Leoneans and median male earnings in the United States with a correlation coefficient (R) of -0.463 and weighted average of $54,279, a difference of 4.4%.
Median Male Earnings Correlation Summary
| Measurement | Portuguese | Sierra Leonean |
| Minimum | $25,598 | $27,751 |
| Maximum | $76,528 | $81,874 |
| Range | $50,930 | $54,123 |
| Mean | $54,293 | $54,478 |
| Median | $54,519 | $53,788 |
| Interquartile 25% (IQ1) | $50,262 | $48,321 |
| Interquartile 75% (IQ3) | $60,181 | $60,630 |
| Interquartile Range (IQR) | $9,919 | $12,308 |
| Standard Deviation (Sample) | $9,132 | $11,493 |
| Standard Deviation (Population) | $9,067 | $11,390 |
Similar Demographics by Median Male Earnings
Demographics Similar to Portuguese by Median Male Earnings
In terms of median male earnings, the demographic groups most similar to Portuguese are Korean ($56,672, a difference of 0.020%), Pakistani ($56,719, a difference of 0.10%), Czech ($56,546, a difference of 0.21%), Immigrants from Germany ($56,542, a difference of 0.21%), and Immigrants from Syria ($56,830, a difference of 0.29%).
| Demographics | Rating | Rank | Median Male Earnings |
| Chileans | 91.9 /100 | #124 | Exceptional $56,973 |
| Immigrants | Morocco | 91.8 /100 | #125 | Exceptional $56,958 |
| Chinese | 91.1 /100 | #126 | Exceptional $56,872 |
| Brazilians | 90.9 /100 | #127 | Exceptional $56,837 |
| Immigrants | Syria | 90.8 /100 | #128 | Exceptional $56,830 |
| Pakistanis | 89.9 /100 | #129 | Excellent $56,719 |
| Koreans | 89.4 /100 | #130 | Excellent $56,672 |
| Portuguese | 89.4 /100 | #131 | Excellent $56,663 |
| Czechs | 88.2 /100 | #132 | Excellent $56,546 |
| Immigrants | Germany | 88.2 /100 | #133 | Excellent $56,542 |
| Moroccans | 87.7 /100 | #134 | Excellent $56,499 |
| Irish | 87.4 /100 | #135 | Excellent $56,464 |
| Immigrants | Saudi Arabia | 87.2 /100 | #136 | Excellent $56,452 |
| Slavs | 86.5 /100 | #137 | Excellent $56,390 |
| Slovaks | 85.5 /100 | #138 | Excellent $56,306 |
Demographics Similar to Sierra Leoneans by Median Male Earnings
In terms of median male earnings, the demographic groups most similar to Sierra Leoneans are Costa Rican ($54,279, a difference of 0.0%), Celtic ($54,242, a difference of 0.070%), Iraqi ($54,182, a difference of 0.18%), Immigrants ($54,168, a difference of 0.21%), and Spaniard ($54,401, a difference of 0.22%).
| Demographics | Rating | Rank | Median Male Earnings |
| Immigrants | Peru | 54.9 /100 | #171 | Average $54,695 |
| Welsh | 53.8 /100 | #172 | Average $54,647 |
| South American Indians | 50.4 /100 | #173 | Average $54,508 |
| South Americans | 50.0 /100 | #174 | Average $54,492 |
| Dutch | 48.0 /100 | #175 | Average $54,410 |
| Spaniards | 47.8 /100 | #176 | Average $54,401 |
| Costa Ricans | 44.8 /100 | #177 | Average $54,279 |
| Sierra Leoneans | 44.8 /100 | #178 | Average $54,279 |
| Celtics | 43.9 /100 | #179 | Average $54,242 |
| Iraqis | 42.5 /100 | #180 | Average $54,182 |
| Immigrants | Immigrants | 42.1 /100 | #181 | Average $54,168 |
| Yugoslavians | 37.4 /100 | #182 | Fair $53,967 |
| Immigrants | South America | 37.3 /100 | #183 | Fair $53,962 |
| Whites/Caucasians | 36.5 /100 | #184 | Fair $53,925 |
| Immigrants | Sierra Leone | 36.0 /100 | #185 | Fair $53,905 |