Portuguese vs Iroquois Unemployment Among Ages 60 to 64 years
COMPARE
Portuguese
Iroquois
Unemployment Among Ages 60 to 64 years
Unemployment Among Ages 60 to 64 years Comparison
Portuguese
Iroquois
4.7%
UNEMPLOYMENT AMONG AGES 60 TO 64 YEARS
97.9/ 100
METRIC RATING
100th/ 347
METRIC RANK
4.7%
UNEMPLOYMENT AMONG AGES 60 TO 64 YEARS
99.1/ 100
METRIC RATING
81st/ 347
METRIC RANK
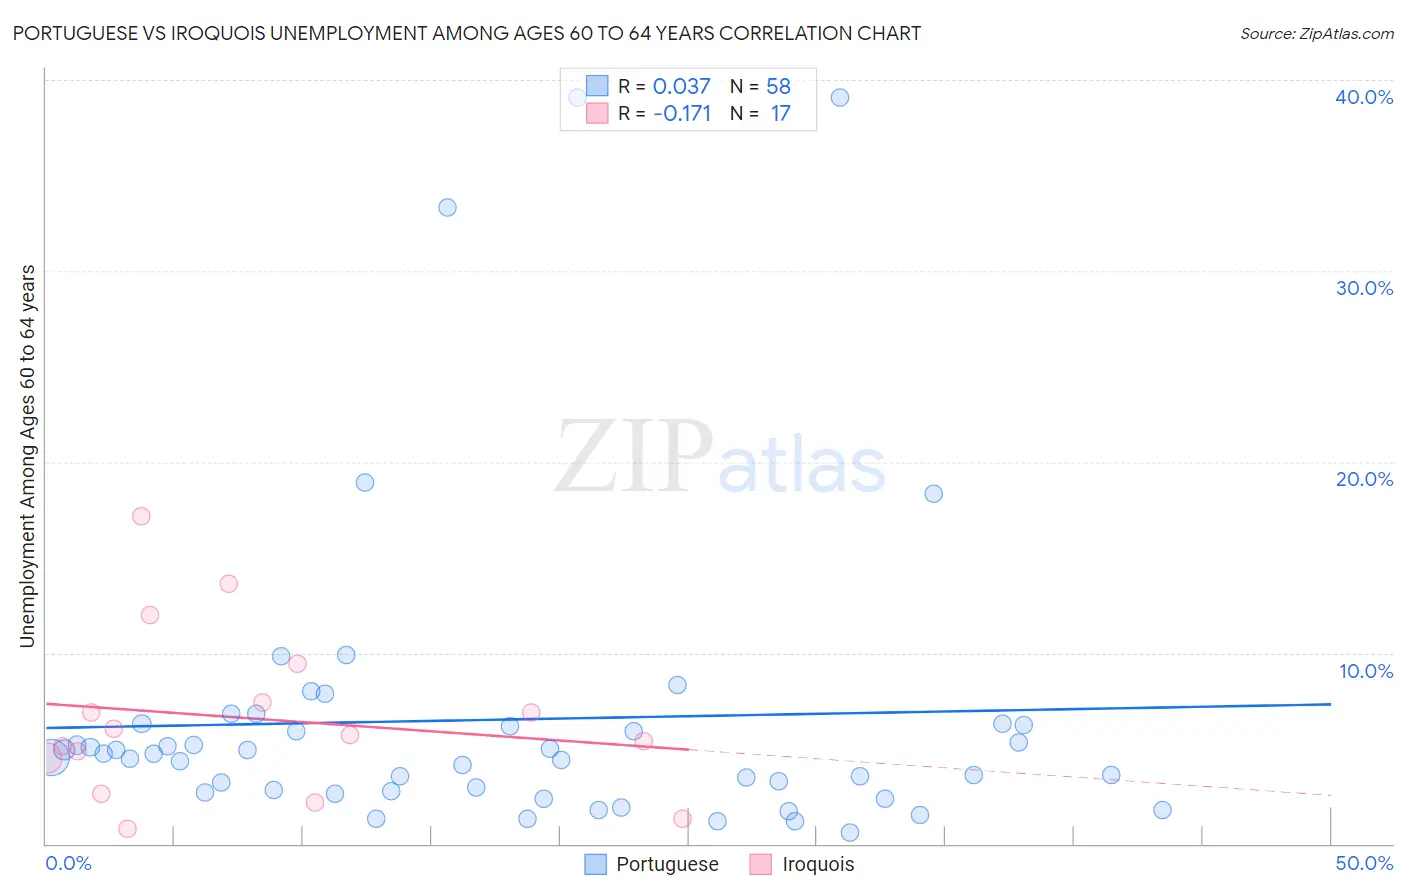
Portuguese vs Iroquois Unemployment Among Ages 60 to 64 years Correlation Chart
The statistical analysis conducted on geographies consisting of 398,687,122 people shows no correlation between the proportion of Portuguese and unemployment rate among population between the ages 60 and 64 in the United States with a correlation coefficient (R) of 0.037 and weighted average of 4.7%. Similarly, the statistical analysis conducted on geographies consisting of 192,997,204 people shows a poor negative correlation between the proportion of Iroquois and unemployment rate among population between the ages 60 and 64 in the United States with a correlation coefficient (R) of -0.171 and weighted average of 4.7%, a difference of 0.83%.
Unemployment Among Ages 60 to 64 years Correlation Summary
| Measurement | Portuguese | Iroquois |
| Minimum | 0.60% | 0.76% |
| Maximum | 39.1% | 17.1% |
| Range | 38.5% | 16.4% |
| Mean | 6.5% | 6.6% |
| Median | 4.6% | 5.7% |
| Interquartile 25% (IQ1) | 2.8% | 3.6% |
| Interquartile 75% (IQ3) | 6.2% | 8.4% |
| Interquartile Range (IQR) | 3.4% | 4.8% |
| Standard Deviation (Sample) | 8.0% | 4.4% |
| Standard Deviation (Population) | 7.9% | 4.3% |
Demographics Similar to Portuguese and Iroquois by Unemployment Among Ages 60 to 64 years
In terms of unemployment among ages 60 to 64 years, the demographic groups most similar to Portuguese are Egyptian (4.7%, a difference of 0.030%), Immigrants from Albania (4.7%, a difference of 0.040%), Somali (4.7%, a difference of 0.040%), Polish (4.7%, a difference of 0.13%), and Serbian (4.7%, a difference of 0.14%). Similarly, the demographic groups most similar to Iroquois are Okinawan (4.7%, a difference of 0.0%), Icelander (4.7%, a difference of 0.010%), Immigrants from Egypt (4.7%, a difference of 0.010%), Thai (4.7%, a difference of 0.21%), and Immigrants from Sri Lanka (4.7%, a difference of 0.21%).
| Demographics | Rating | Rank | Unemployment Among Ages 60 to 64 years |
| Icelanders | 99.1 /100 | #80 | Exceptional 4.7% |
| Iroquois | 99.1 /100 | #81 | Exceptional 4.7% |
| Okinawans | 99.1 /100 | #82 | Exceptional 4.7% |
| Immigrants | Egypt | 99.1 /100 | #83 | Exceptional 4.7% |
| Thais | 98.9 /100 | #84 | Exceptional 4.7% |
| Immigrants | Sri Lanka | 98.9 /100 | #85 | Exceptional 4.7% |
| Immigrants | Oceania | 98.9 /100 | #86 | Exceptional 4.7% |
| Immigrants | Jordan | 98.8 /100 | #87 | Exceptional 4.7% |
| Immigrants | Bulgaria | 98.7 /100 | #88 | Exceptional 4.7% |
| Immigrants | Northern Africa | 98.7 /100 | #89 | Exceptional 4.7% |
| Immigrants | Liberia | 98.7 /100 | #90 | Exceptional 4.7% |
| Immigrants | Uganda | 98.4 /100 | #91 | Exceptional 4.7% |
| Romanians | 98.4 /100 | #92 | Exceptional 4.7% |
| Immigrants | Saudi Arabia | 98.3 /100 | #93 | Exceptional 4.7% |
| Immigrants | Kuwait | 98.3 /100 | #94 | Exceptional 4.7% |
| Serbians | 98.2 /100 | #95 | Exceptional 4.7% |
| Poles | 98.1 /100 | #96 | Exceptional 4.7% |
| Immigrants | Albania | 98.0 /100 | #97 | Exceptional 4.7% |
| Somalis | 98.0 /100 | #98 | Exceptional 4.7% |
| Egyptians | 98.0 /100 | #99 | Exceptional 4.7% |
| Portuguese | 97.9 /100 | #100 | Exceptional 4.7% |