Ukrainian vs Puerto Rican Householder Income Ages 25 - 44 years
COMPARE
Ukrainian
Puerto Rican
Householder Income Ages 25 - 44 years
Householder Income Ages 25 - 44 years Comparison
Ukrainians
Puerto Ricans
$102,451
HOUSEHOLDER INCOME AGES 25 - 44 YEARS
98.8/ 100
METRIC RATING
90th/ 347
METRIC RANK
$65,996
HOUSEHOLDER INCOME AGES 25 - 44 YEARS
0.0/ 100
METRIC RATING
346th/ 347
METRIC RANK
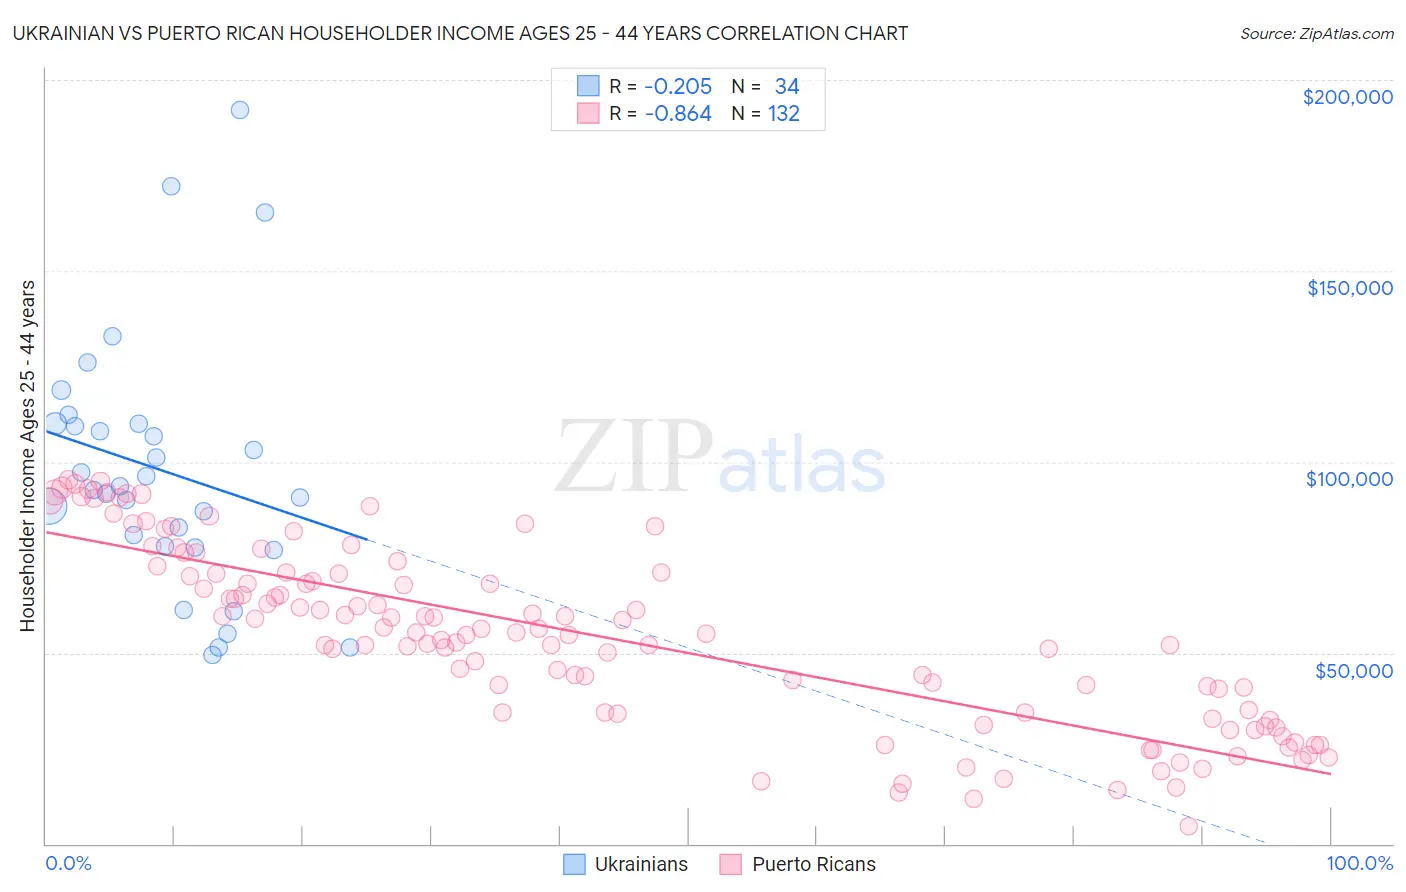
Ukrainian vs Puerto Rican Householder Income Ages 25 - 44 years Correlation Chart
The statistical analysis conducted on geographies consisting of 446,911,456 people shows a weak negative correlation between the proportion of Ukrainians and household income with householder between the ages 25 and 44 in the United States with a correlation coefficient (R) of -0.205 and weighted average of $102,451. Similarly, the statistical analysis conducted on geographies consisting of 525,288,469 people shows a very strong negative correlation between the proportion of Puerto Ricans and household income with householder between the ages 25 and 44 in the United States with a correlation coefficient (R) of -0.864 and weighted average of $65,996, a difference of 55.2%.
Householder Income Ages 25 - 44 years Correlation Summary
| Measurement | Ukrainian | Puerto Rican |
| Minimum | $49,533 | $4,659 |
| Maximum | $192,200 | $95,273 |
| Range | $142,666 | $90,614 |
| Mean | $97,681 | $54,540 |
| Median | $93,249 | $55,330 |
| Interquartile 25% (IQ1) | $77,819 | $34,463 |
| Interquartile 75% (IQ3) | $109,920 | $70,867 |
| Interquartile Range (IQR) | $32,101 | $36,404 |
| Standard Deviation (Sample) | $32,854 | $23,369 |
| Standard Deviation (Population) | $32,367 | $23,280 |
Similar Demographics by Householder Income Ages 25 - 44 years
Demographics Similar to Ukrainians by Householder Income Ages 25 - 44 years
In terms of householder income ages 25 - 44 years, the demographic groups most similar to Ukrainians are Croatian ($102,414, a difference of 0.040%), Immigrants from North America ($102,407, a difference of 0.040%), Romanian ($102,544, a difference of 0.090%), Immigrants from Canada ($102,616, a difference of 0.16%), and Immigrants from Hungary ($102,655, a difference of 0.20%).
| Demographics | Rating | Rank | Householder Income Ages 25 - 44 years |
| Argentineans | 99.1 /100 | #83 | Exceptional $103,111 |
| Immigrants | Philippines | 99.0 /100 | #84 | Exceptional $102,910 |
| Immigrants | Ukraine | 98.9 /100 | #85 | Exceptional $102,664 |
| Immigrants | Hungary | 98.9 /100 | #86 | Exceptional $102,655 |
| Immigrants | Western Europe | 98.9 /100 | #87 | Exceptional $102,654 |
| Immigrants | Canada | 98.9 /100 | #88 | Exceptional $102,616 |
| Romanians | 98.8 /100 | #89 | Exceptional $102,544 |
| Ukrainians | 98.8 /100 | #90 | Exceptional $102,451 |
| Croatians | 98.7 /100 | #91 | Exceptional $102,414 |
| Immigrants | North America | 98.7 /100 | #92 | Exceptional $102,407 |
| Immigrants | England | 98.4 /100 | #93 | Exceptional $102,020 |
| Sri Lankans | 98.4 /100 | #94 | Exceptional $101,960 |
| Assyrians/Chaldeans/Syriacs | 98.3 /100 | #95 | Exceptional $101,936 |
| Macedonians | 98.3 /100 | #96 | Exceptional $101,882 |
| Austrians | 98.3 /100 | #97 | Exceptional $101,842 |
Demographics Similar to Puerto Ricans by Householder Income Ages 25 - 44 years
In terms of householder income ages 25 - 44 years, the demographic groups most similar to Puerto Ricans are Navajo ($66,529, a difference of 0.81%), Pueblo ($68,910, a difference of 4.4%), Tohono O'odham ($69,068, a difference of 4.6%), Crow ($71,337, a difference of 8.1%), and Arapaho ($71,697, a difference of 8.6%).
| Demographics | Rating | Rank | Householder Income Ages 25 - 44 years |
| Hopi | 0.0 /100 | #333 | Tragic $75,002 |
| Creek | 0.0 /100 | #334 | Tragic $74,847 |
| Kiowa | 0.0 /100 | #335 | Tragic $74,776 |
| Yup'ik | 0.0 /100 | #336 | Tragic $73,688 |
| Blacks/African Americans | 0.0 /100 | #337 | Tragic $73,370 |
| Immigrants | Yemen | 0.0 /100 | #338 | Tragic $73,043 |
| Yuman | 0.0 /100 | #339 | Tragic $72,956 |
| Immigrants | Congo | 0.0 /100 | #340 | Tragic $72,178 |
| Arapaho | 0.0 /100 | #341 | Tragic $71,697 |
| Crow | 0.0 /100 | #342 | Tragic $71,337 |
| Tohono O'odham | 0.0 /100 | #343 | Tragic $69,068 |
| Pueblo | 0.0 /100 | #344 | Tragic $68,910 |
| Navajo | 0.0 /100 | #345 | Tragic $66,529 |
| Puerto Ricans | 0.0 /100 | #346 | Tragic $65,996 |
| Lumbee | 0.0 /100 | #347 | Tragic $60,305 |