Latvian vs Puerto Rican Householder Income Ages 25 - 44 years
COMPARE
Latvian
Puerto Rican
Householder Income Ages 25 - 44 years
Householder Income Ages 25 - 44 years Comparison
Latvians
Puerto Ricans
$108,926
HOUSEHOLDER INCOME AGES 25 - 44 YEARS
100.0/ 100
METRIC RATING
36th/ 347
METRIC RANK
$65,996
HOUSEHOLDER INCOME AGES 25 - 44 YEARS
0.0/ 100
METRIC RATING
346th/ 347
METRIC RANK
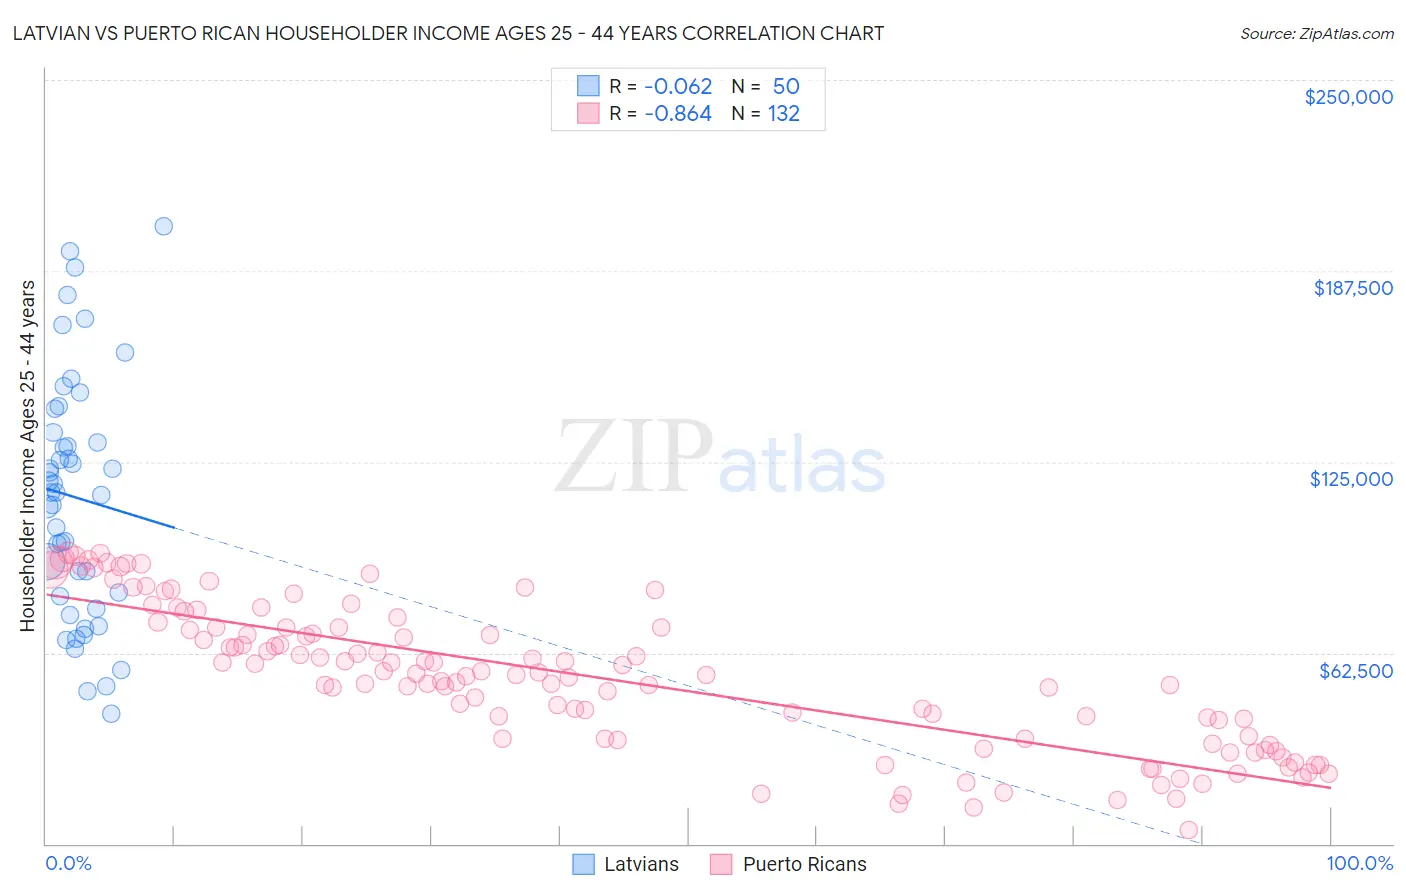
Latvian vs Puerto Rican Householder Income Ages 25 - 44 years Correlation Chart
The statistical analysis conducted on geographies consisting of 220,250,267 people shows a slight negative correlation between the proportion of Latvians and household income with householder between the ages 25 and 44 in the United States with a correlation coefficient (R) of -0.062 and weighted average of $108,926. Similarly, the statistical analysis conducted on geographies consisting of 525,288,469 people shows a very strong negative correlation between the proportion of Puerto Ricans and household income with householder between the ages 25 and 44 in the United States with a correlation coefficient (R) of -0.864 and weighted average of $65,996, a difference of 65.0%.
Householder Income Ages 25 - 44 years Correlation Summary
| Measurement | Latvian | Puerto Rican |
| Minimum | $42,679 | $4,659 |
| Maximum | $202,188 | $95,273 |
| Range | $159,509 | $90,614 |
| Mean | $113,340 | $54,540 |
| Median | $114,915 | $55,330 |
| Interquartile 25% (IQ1) | $80,877 | $34,463 |
| Interquartile 75% (IQ3) | $134,488 | $70,867 |
| Interquartile Range (IQR) | $53,611 | $36,404 |
| Standard Deviation (Sample) | $39,584 | $23,369 |
| Standard Deviation (Population) | $39,186 | $23,280 |
Similar Demographics by Householder Income Ages 25 - 44 years
Demographics Similar to Latvians by Householder Income Ages 25 - 44 years
In terms of householder income ages 25 - 44 years, the demographic groups most similar to Latvians are Immigrants from Russia ($108,751, a difference of 0.16%), Immigrants from Switzerland ($109,185, a difference of 0.24%), Bolivian ($109,372, a difference of 0.41%), Soviet Union ($108,457, a difference of 0.43%), and Bhutanese ($109,520, a difference of 0.55%).
| Demographics | Rating | Rank | Householder Income Ages 25 - 44 years |
| Turks | 100.0 /100 | #29 | Exceptional $110,318 |
| Immigrants | Greece | 100.0 /100 | #30 | Exceptional $110,103 |
| Maltese | 100.0 /100 | #31 | Exceptional $110,064 |
| Immigrants | Sri Lanka | 100.0 /100 | #32 | Exceptional $109,741 |
| Bhutanese | 100.0 /100 | #33 | Exceptional $109,520 |
| Bolivians | 100.0 /100 | #34 | Exceptional $109,372 |
| Immigrants | Switzerland | 100.0 /100 | #35 | Exceptional $109,185 |
| Latvians | 100.0 /100 | #36 | Exceptional $108,926 |
| Immigrants | Russia | 100.0 /100 | #37 | Exceptional $108,751 |
| Soviet Union | 100.0 /100 | #38 | Exceptional $108,457 |
| Immigrants | France | 99.9 /100 | #39 | Exceptional $108,257 |
| Immigrants | Lithuania | 99.9 /100 | #40 | Exceptional $108,149 |
| Immigrants | Bolivia | 99.9 /100 | #41 | Exceptional $108,128 |
| Australians | 99.9 /100 | #42 | Exceptional $107,912 |
| Immigrants | Malaysia | 99.9 /100 | #43 | Exceptional $107,650 |
Demographics Similar to Puerto Ricans by Householder Income Ages 25 - 44 years
In terms of householder income ages 25 - 44 years, the demographic groups most similar to Puerto Ricans are Navajo ($66,529, a difference of 0.81%), Pueblo ($68,910, a difference of 4.4%), Tohono O'odham ($69,068, a difference of 4.6%), Crow ($71,337, a difference of 8.1%), and Arapaho ($71,697, a difference of 8.6%).
| Demographics | Rating | Rank | Householder Income Ages 25 - 44 years |
| Hopi | 0.0 /100 | #333 | Tragic $75,002 |
| Creek | 0.0 /100 | #334 | Tragic $74,847 |
| Kiowa | 0.0 /100 | #335 | Tragic $74,776 |
| Yup'ik | 0.0 /100 | #336 | Tragic $73,688 |
| Blacks/African Americans | 0.0 /100 | #337 | Tragic $73,370 |
| Immigrants | Yemen | 0.0 /100 | #338 | Tragic $73,043 |
| Yuman | 0.0 /100 | #339 | Tragic $72,956 |
| Immigrants | Congo | 0.0 /100 | #340 | Tragic $72,178 |
| Arapaho | 0.0 /100 | #341 | Tragic $71,697 |
| Crow | 0.0 /100 | #342 | Tragic $71,337 |
| Tohono O'odham | 0.0 /100 | #343 | Tragic $69,068 |
| Pueblo | 0.0 /100 | #344 | Tragic $68,910 |
| Navajo | 0.0 /100 | #345 | Tragic $66,529 |
| Puerto Ricans | 0.0 /100 | #346 | Tragic $65,996 |
| Lumbee | 0.0 /100 | #347 | Tragic $60,305 |