Cypriot vs Palestinian Median Male Earnings
COMPARE
Cypriot
Palestinian
Median Male Earnings
Median Male Earnings Comparison
Cypriots
Palestinians
$65,549
MEDIAN MALE EARNINGS
100.0/ 100
METRIC RATING
19th/ 347
METRIC RANK
$57,778
MEDIAN MALE EARNINGS
96.2/ 100
METRIC RATING
110th/ 347
METRIC RANK
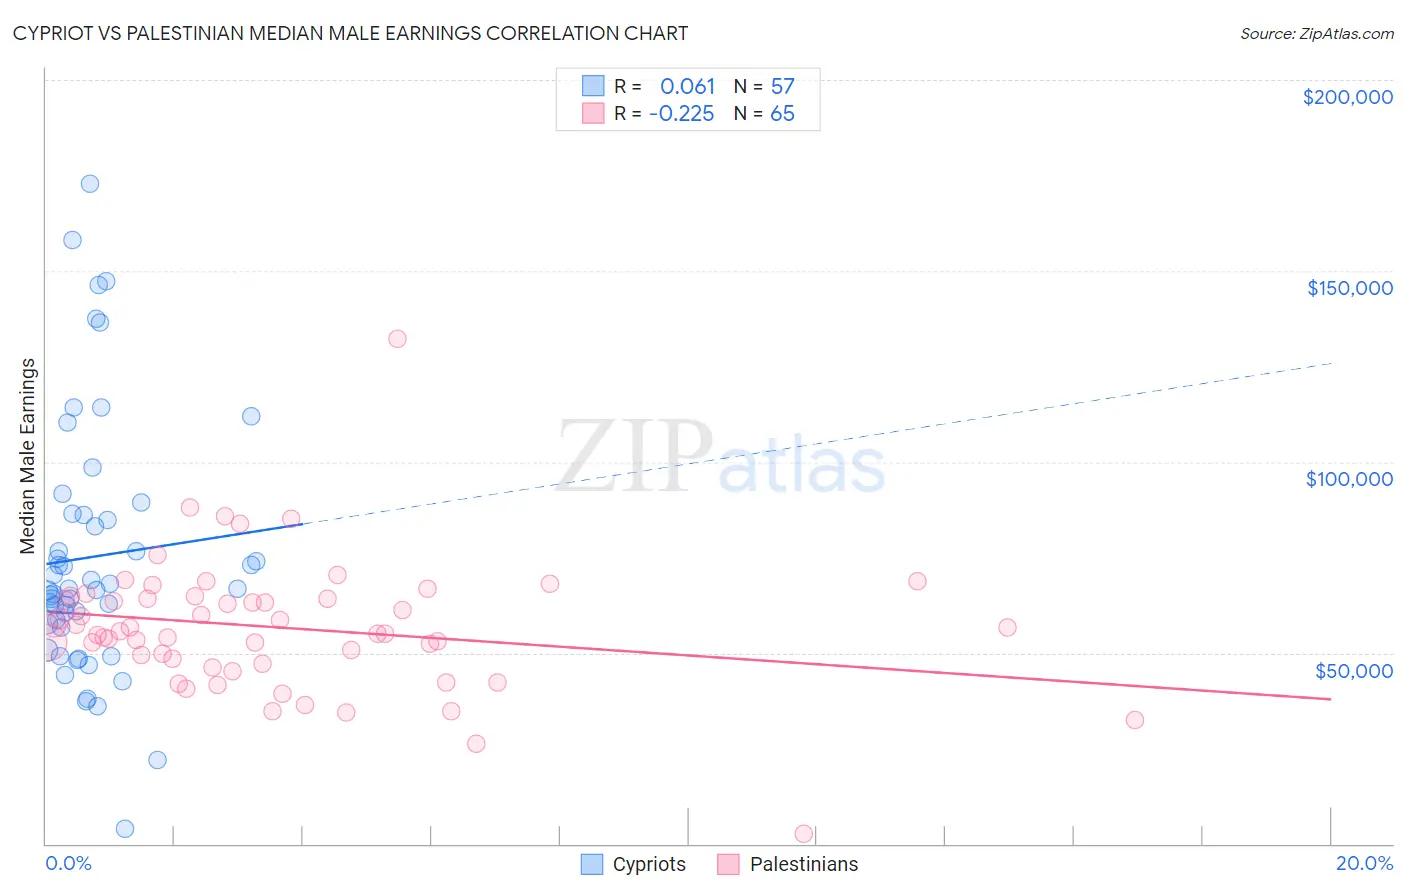
Cypriot vs Palestinian Median Male Earnings Correlation Chart
The statistical analysis conducted on geographies consisting of 61,867,128 people shows a slight positive correlation between the proportion of Cypriots and median male earnings in the United States with a correlation coefficient (R) of 0.061 and weighted average of $65,549. Similarly, the statistical analysis conducted on geographies consisting of 216,446,429 people shows a weak negative correlation between the proportion of Palestinians and median male earnings in the United States with a correlation coefficient (R) of -0.225 and weighted average of $57,778, a difference of 13.5%.
Median Male Earnings Correlation Summary
| Measurement | Cypriot | Palestinian |
| Minimum | $3,864 | $2,499 |
| Maximum | $172,778 | $132,344 |
| Range | $168,914 | $129,845 |
| Mean | $75,157 | $56,632 |
| Median | $66,784 | $55,657 |
| Interquartile 25% (IQ1) | $56,985 | $47,716 |
| Interquartile 75% (IQ3) | $86,286 | $64,385 |
| Interquartile Range (IQR) | $29,301 | $16,670 |
| Standard Deviation (Sample) | $33,466 | $17,442 |
| Standard Deviation (Population) | $33,171 | $17,308 |
Similar Demographics by Median Male Earnings
Demographics Similar to Cypriots by Median Male Earnings
In terms of median male earnings, the demographic groups most similar to Cypriots are Immigrants from Japan ($65,518, a difference of 0.050%), Immigrants from Sweden ($65,406, a difference of 0.22%), Burmese ($65,236, a difference of 0.48%), Immigrants from Korea ($65,079, a difference of 0.72%), and Indian (Asian) ($66,078, a difference of 0.81%).
| Demographics | Rating | Rank | Median Male Earnings |
| Immigrants | Australia | 100.0 /100 | #12 | Exceptional $67,634 |
| Immigrants | China | 100.0 /100 | #13 | Exceptional $67,353 |
| Okinawans | 100.0 /100 | #14 | Exceptional $67,232 |
| Immigrants | Eastern Asia | 100.0 /100 | #15 | Exceptional $66,903 |
| Eastern Europeans | 100.0 /100 | #16 | Exceptional $66,472 |
| Immigrants | Belgium | 100.0 /100 | #17 | Exceptional $66,125 |
| Indians (Asian) | 100.0 /100 | #18 | Exceptional $66,078 |
| Cypriots | 100.0 /100 | #19 | Exceptional $65,549 |
| Immigrants | Japan | 100.0 /100 | #20 | Exceptional $65,518 |
| Immigrants | Sweden | 100.0 /100 | #21 | Exceptional $65,406 |
| Burmese | 100.0 /100 | #22 | Exceptional $65,236 |
| Immigrants | Korea | 100.0 /100 | #23 | Exceptional $65,079 |
| Immigrants | Northern Europe | 100.0 /100 | #24 | Exceptional $64,987 |
| Immigrants | Denmark | 100.0 /100 | #25 | Exceptional $64,625 |
| Turks | 100.0 /100 | #26 | Exceptional $64,253 |
Demographics Similar to Palestinians by Median Male Earnings
In terms of median male earnings, the demographic groups most similar to Palestinians are British ($57,890, a difference of 0.19%), European ($57,637, a difference of 0.25%), Immigrants from Uzbekistan ($57,941, a difference of 0.28%), Serbian ($57,975, a difference of 0.34%), and Immigrants from Afghanistan ($57,582, a difference of 0.34%).
| Demographics | Rating | Rank | Median Male Earnings |
| Poles | 97.3 /100 | #103 | Exceptional $58,139 |
| Armenians | 97.3 /100 | #104 | Exceptional $58,134 |
| Immigrants | Western Asia | 97.3 /100 | #105 | Exceptional $58,131 |
| Immigrants | Northern Africa | 96.9 /100 | #106 | Exceptional $58,008 |
| Serbians | 96.8 /100 | #107 | Exceptional $57,975 |
| Immigrants | Uzbekistan | 96.7 /100 | #108 | Exceptional $57,941 |
| British | 96.5 /100 | #109 | Exceptional $57,890 |
| Palestinians | 96.2 /100 | #110 | Exceptional $57,778 |
| Europeans | 95.6 /100 | #111 | Exceptional $57,637 |
| Immigrants | Afghanistan | 95.4 /100 | #112 | Exceptional $57,582 |
| Carpatho Rusyns | 95.3 /100 | #113 | Exceptional $57,572 |
| Immigrants | Kuwait | 95.3 /100 | #114 | Exceptional $57,562 |
| Swedes | 94.8 /100 | #115 | Exceptional $57,445 |
| Lebanese | 94.6 /100 | #116 | Exceptional $57,409 |
| Immigrants | Zimbabwe | 94.3 /100 | #117 | Exceptional $57,352 |