Cypriot vs Latvian Householder Income Ages 25 - 44 years
COMPARE
Cypriot
Latvian
Householder Income Ages 25 - 44 years
Householder Income Ages 25 - 44 years Comparison
Cypriots
Latvians
$116,364
HOUSEHOLDER INCOME AGES 25 - 44 YEARS
100.0/ 100
METRIC RATING
16th/ 347
METRIC RANK
$108,926
HOUSEHOLDER INCOME AGES 25 - 44 YEARS
100.0/ 100
METRIC RATING
36th/ 347
METRIC RANK
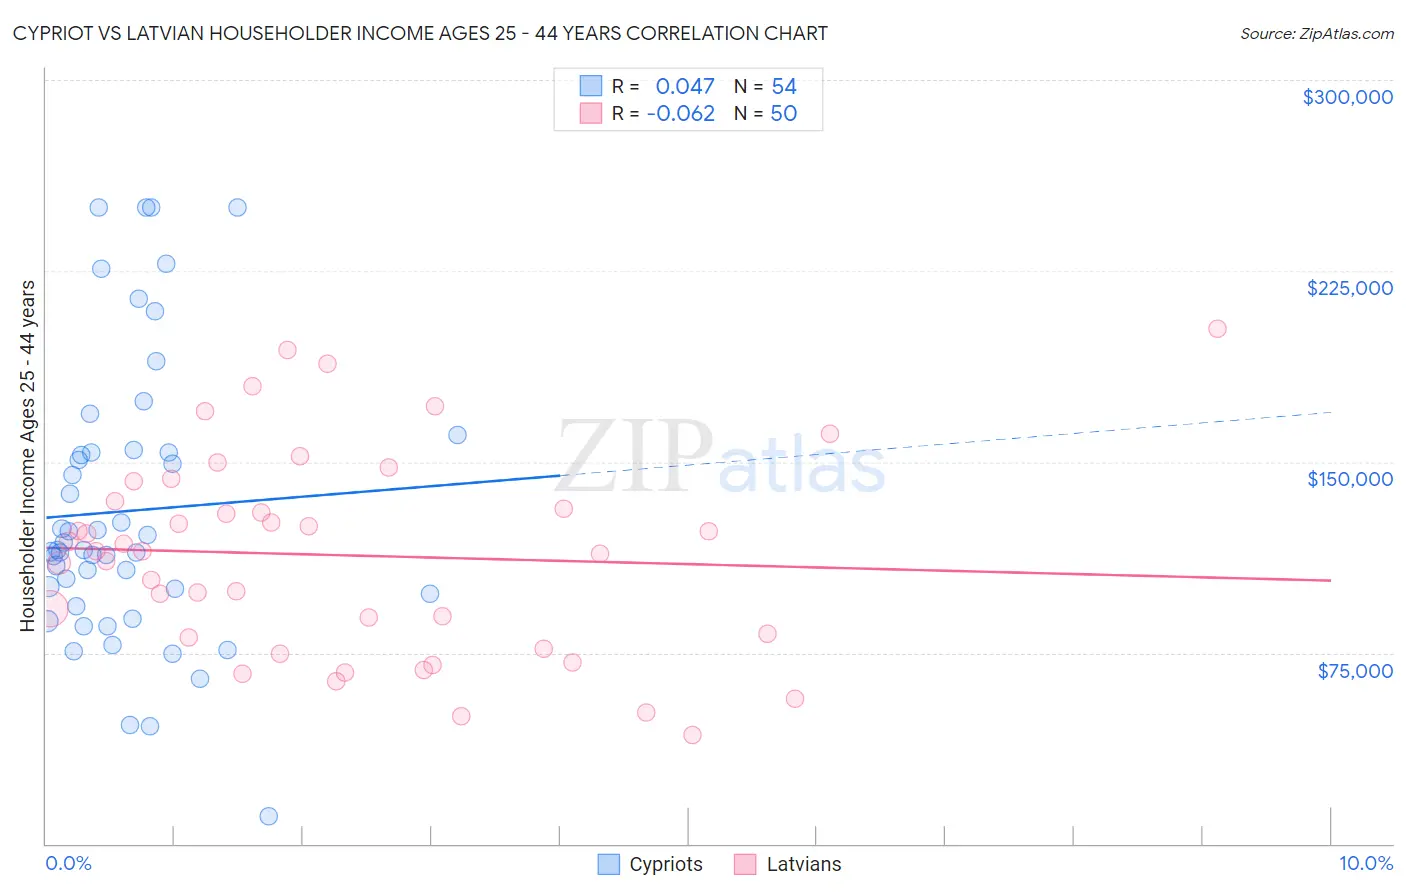
Cypriot vs Latvian Householder Income Ages 25 - 44 years Correlation Chart
The statistical analysis conducted on geographies consisting of 61,825,941 people shows no correlation between the proportion of Cypriots and household income with householder between the ages 25 and 44 in the United States with a correlation coefficient (R) of 0.047 and weighted average of $116,364. Similarly, the statistical analysis conducted on geographies consisting of 220,250,267 people shows a slight negative correlation between the proportion of Latvians and household income with householder between the ages 25 and 44 in the United States with a correlation coefficient (R) of -0.062 and weighted average of $108,926, a difference of 6.8%.
Householder Income Ages 25 - 44 years Correlation Summary
| Measurement | Cypriot | Latvian |
| Minimum | $10,800 | $42,679 |
| Maximum | $250,001 | $202,188 |
| Range | $239,201 | $159,509 |
| Mean | $130,678 | $113,340 |
| Median | $115,469 | $114,915 |
| Interquartile 25% (IQ1) | $98,043 | $80,877 |
| Interquartile 75% (IQ3) | $153,715 | $134,488 |
| Interquartile Range (IQR) | $55,672 | $53,611 |
| Standard Deviation (Sample) | $55,115 | $39,584 |
| Standard Deviation (Population) | $54,602 | $39,186 |
Demographics Similar to Cypriots and Latvians by Householder Income Ages 25 - 44 years
In terms of householder income ages 25 - 44 years, the demographic groups most similar to Cypriots are Immigrants from Australia ($115,947, a difference of 0.36%), Eastern European ($114,523, a difference of 1.6%), Burmese ($113,701, a difference of 2.3%), Immigrants from Korea ($113,401, a difference of 2.6%), and Asian ($112,666, a difference of 3.3%). Similarly, the demographic groups most similar to Latvians are Immigrants from Switzerland ($109,185, a difference of 0.24%), Bolivian ($109,372, a difference of 0.41%), Bhutanese ($109,520, a difference of 0.55%), Immigrants from Sri Lanka ($109,741, a difference of 0.75%), and Maltese ($110,064, a difference of 1.0%).
| Demographics | Rating | Rank | Householder Income Ages 25 - 44 years |
| Cypriots | 100.0 /100 | #16 | Exceptional $116,364 |
| Immigrants | Australia | 100.0 /100 | #17 | Exceptional $115,947 |
| Eastern Europeans | 100.0 /100 | #18 | Exceptional $114,523 |
| Burmese | 100.0 /100 | #19 | Exceptional $113,701 |
| Immigrants | Korea | 100.0 /100 | #20 | Exceptional $113,401 |
| Asians | 100.0 /100 | #21 | Exceptional $112,666 |
| Immigrants | Belgium | 100.0 /100 | #22 | Exceptional $112,575 |
| Immigrants | Japan | 100.0 /100 | #23 | Exceptional $112,228 |
| Immigrants | Sweden | 100.0 /100 | #24 | Exceptional $112,010 |
| Immigrants | Northern Europe | 100.0 /100 | #25 | Exceptional $111,676 |
| Immigrants | Asia | 100.0 /100 | #26 | Exceptional $110,787 |
| Russians | 100.0 /100 | #27 | Exceptional $110,398 |
| Immigrants | Denmark | 100.0 /100 | #28 | Exceptional $110,363 |
| Turks | 100.0 /100 | #29 | Exceptional $110,318 |
| Immigrants | Greece | 100.0 /100 | #30 | Exceptional $110,103 |
| Maltese | 100.0 /100 | #31 | Exceptional $110,064 |
| Immigrants | Sri Lanka | 100.0 /100 | #32 | Exceptional $109,741 |
| Bhutanese | 100.0 /100 | #33 | Exceptional $109,520 |
| Bolivians | 100.0 /100 | #34 | Exceptional $109,372 |
| Immigrants | Switzerland | 100.0 /100 | #35 | Exceptional $109,185 |
| Latvians | 100.0 /100 | #36 | Exceptional $108,926 |