Immigrants from Costa Rica vs Guamanian/Chamorro Householder Income Ages 25 - 44 years
COMPARE
Immigrants from Costa Rica
Guamanian/Chamorro
Householder Income Ages 25 - 44 years
Householder Income Ages 25 - 44 years Comparison
Immigrants from Costa Rica
Guamanians/Chamorros
$92,876
HOUSEHOLDER INCOME AGES 25 - 44 YEARS
28.2/ 100
METRIC RATING
192nd/ 347
METRIC RANK
$93,569
HOUSEHOLDER INCOME AGES 25 - 44 YEARS
36.5/ 100
METRIC RATING
183rd/ 347
METRIC RANK
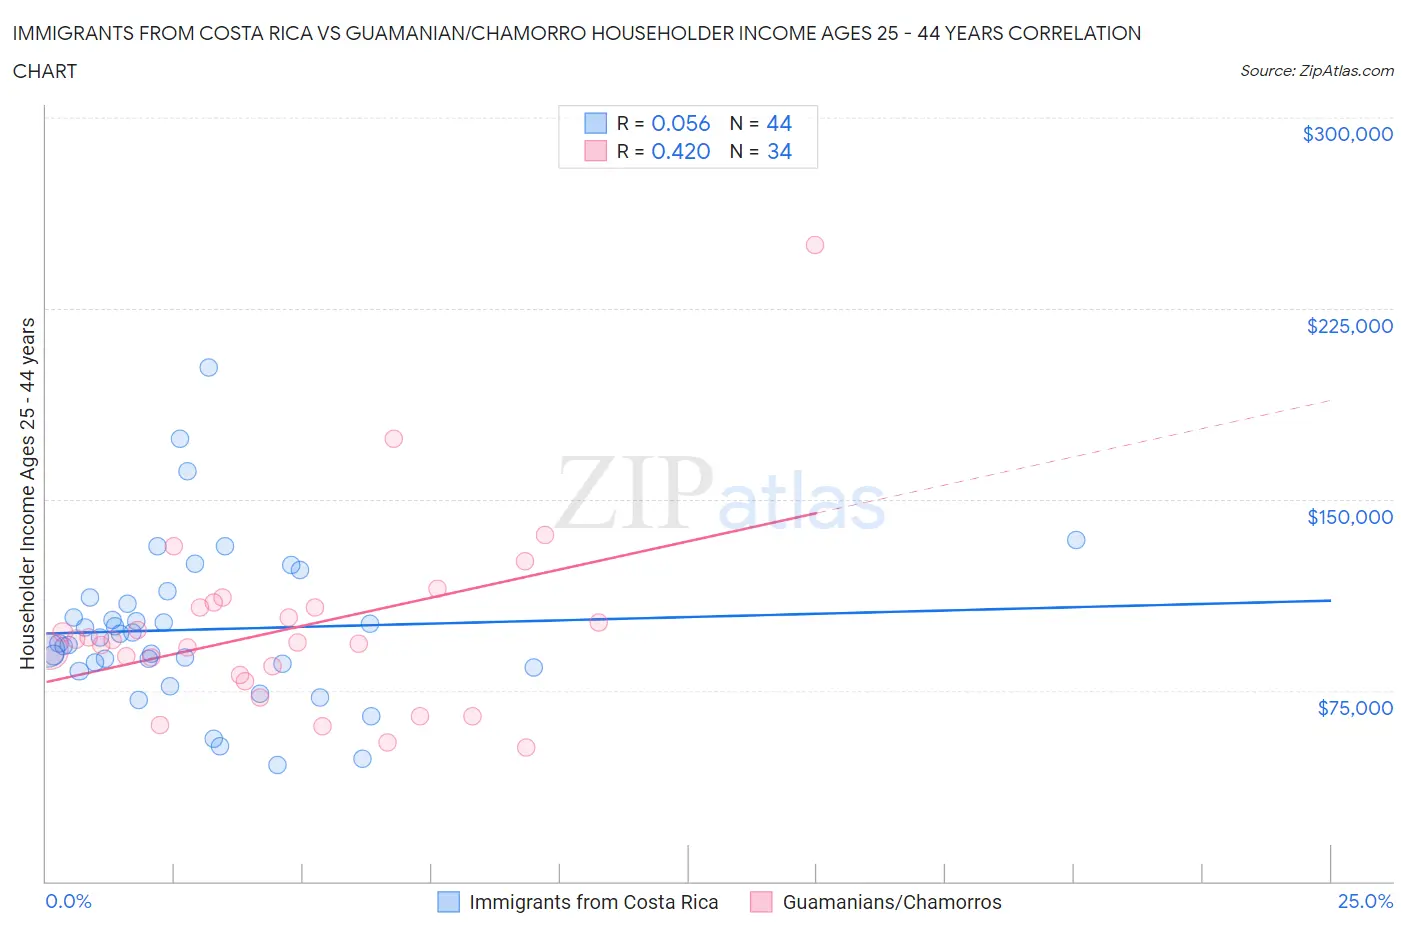
Immigrants from Costa Rica vs Guamanian/Chamorro Householder Income Ages 25 - 44 years Correlation Chart
The statistical analysis conducted on geographies consisting of 204,048,993 people shows a slight positive correlation between the proportion of Immigrants from Costa Rica and household income with householder between the ages 25 and 44 in the United States with a correlation coefficient (R) of 0.056 and weighted average of $92,876. Similarly, the statistical analysis conducted on geographies consisting of 221,693,514 people shows a moderate positive correlation between the proportion of Guamanians/Chamorros and household income with householder between the ages 25 and 44 in the United States with a correlation coefficient (R) of 0.420 and weighted average of $93,569, a difference of 0.75%.
Householder Income Ages 25 - 44 years Correlation Summary
| Measurement | Immigrants from Costa Rica | Guamanian/Chamorro |
| Minimum | $45,556 | $52,500 |
| Maximum | $201,608 | $250,001 |
| Range | $156,052 | $197,501 |
| Mean | $98,859 | $99,073 |
| Median | $94,496 | $94,237 |
| Interquartile 25% (IQ1) | $84,714 | $81,009 |
| Interquartile 75% (IQ3) | $110,006 | $107,396 |
| Interquartile Range (IQR) | $25,292 | $26,387 |
| Standard Deviation (Sample) | $30,715 | $36,403 |
| Standard Deviation (Population) | $30,364 | $35,864 |
Demographics Similar to Immigrants from Costa Rica and Guamanians/Chamorros by Householder Income Ages 25 - 44 years
In terms of householder income ages 25 - 44 years, the demographic groups most similar to Immigrants from Costa Rica are Tlingit-Haida ($92,987, a difference of 0.12%), Welsh ($93,039, a difference of 0.18%), Dutch ($93,081, a difference of 0.22%), Immigrants from Sierra Leone ($93,115, a difference of 0.26%), and Spaniard ($93,366, a difference of 0.53%). Similarly, the demographic groups most similar to Guamanians/Chamorros are German ($93,531, a difference of 0.040%), Uruguayan ($93,631, a difference of 0.070%), French ($93,665, a difference of 0.10%), Puget Sound Salish ($93,661, a difference of 0.10%), and Immigrants from Eritrea ($93,466, a difference of 0.11%).
| Demographics | Rating | Rank | Householder Income Ages 25 - 44 years |
| Belgians | 45.8 /100 | #177 | Average $94,262 |
| Immigrants | South America | 42.8 /100 | #178 | Average $94,042 |
| French Canadians | 38.2 /100 | #179 | Fair $93,694 |
| French | 37.8 /100 | #180 | Fair $93,665 |
| Puget Sound Salish | 37.7 /100 | #181 | Fair $93,661 |
| Uruguayans | 37.3 /100 | #182 | Fair $93,631 |
| Guamanians/Chamorros | 36.5 /100 | #183 | Fair $93,569 |
| Germans | 36.0 /100 | #184 | Fair $93,531 |
| Immigrants | Eritrea | 35.2 /100 | #185 | Fair $93,466 |
| Sierra Leoneans | 34.8 /100 | #186 | Fair $93,435 |
| Spaniards | 34.0 /100 | #187 | Fair $93,366 |
| Immigrants | Sierra Leone | 30.9 /100 | #188 | Fair $93,115 |
| Dutch | 30.5 /100 | #189 | Fair $93,081 |
| Welsh | 30.0 /100 | #190 | Fair $93,039 |
| Tlingit-Haida | 29.4 /100 | #191 | Fair $92,987 |
| Immigrants | Costa Rica | 28.2 /100 | #192 | Fair $92,876 |
| Samoans | 23.0 /100 | #193 | Fair $92,385 |
| Immigrants | Azores | 22.4 /100 | #194 | Fair $92,322 |
| Celtics | 21.6 /100 | #195 | Fair $92,241 |
| Immigrants | Colombia | 21.3 /100 | #196 | Fair $92,204 |
| Spanish | 21.2 /100 | #197 | Fair $92,200 |