Bangladeshi vs Guamanian/Chamorro Householder Income Ages 25 - 44 years
COMPARE
Bangladeshi
Guamanian/Chamorro
Householder Income Ages 25 - 44 years
Householder Income Ages 25 - 44 years Comparison
Bangladeshis
Guamanians/Chamorros
$81,363
HOUSEHOLDER INCOME AGES 25 - 44 YEARS
0.1/ 100
METRIC RATING
295th/ 347
METRIC RANK
$93,569
HOUSEHOLDER INCOME AGES 25 - 44 YEARS
36.5/ 100
METRIC RATING
183rd/ 347
METRIC RANK
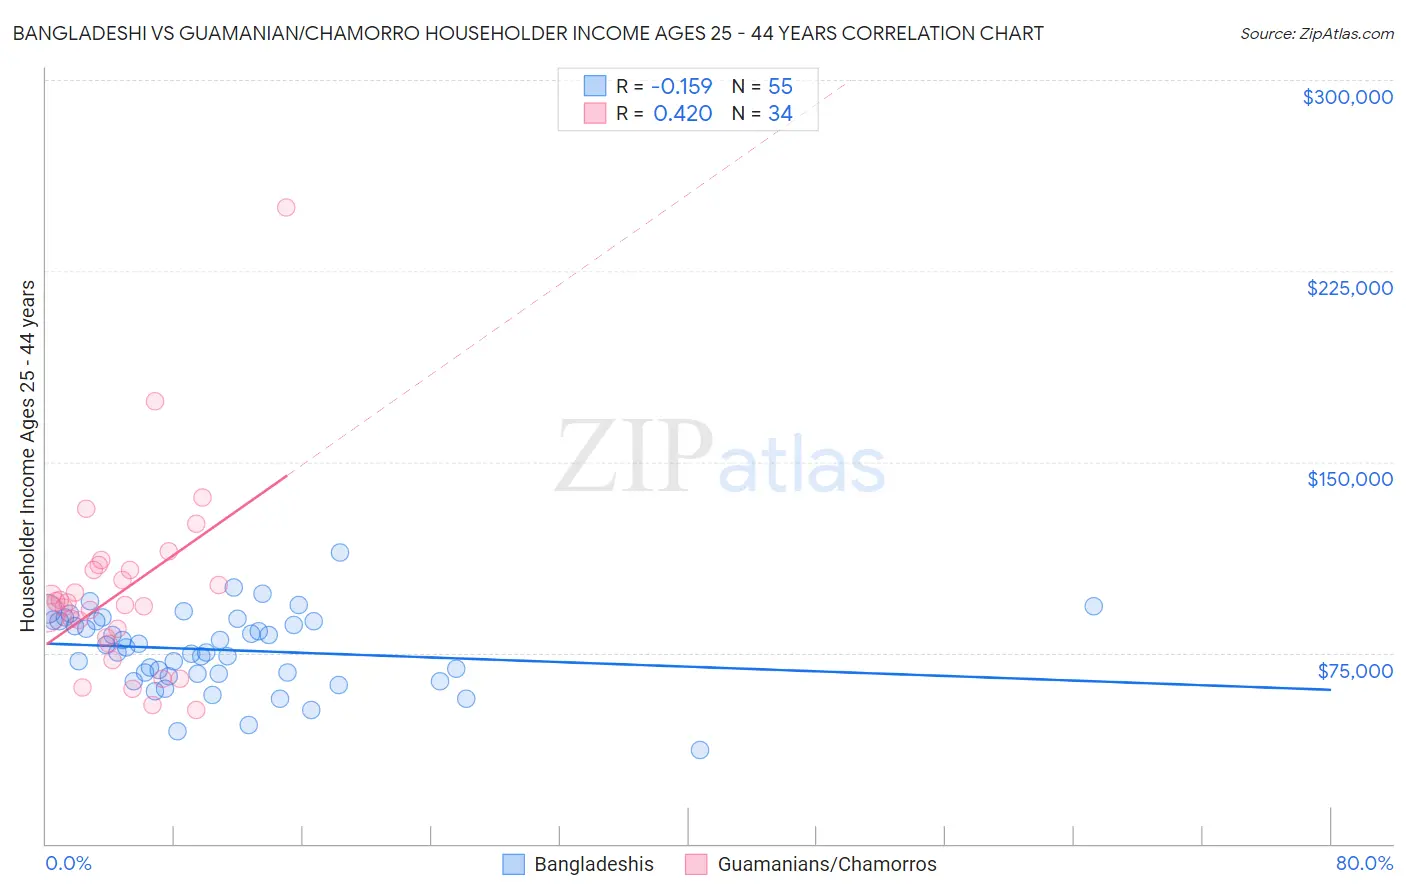
Bangladeshi vs Guamanian/Chamorro Householder Income Ages 25 - 44 years Correlation Chart
The statistical analysis conducted on geographies consisting of 141,274,107 people shows a poor negative correlation between the proportion of Bangladeshis and household income with householder between the ages 25 and 44 in the United States with a correlation coefficient (R) of -0.159 and weighted average of $81,363. Similarly, the statistical analysis conducted on geographies consisting of 221,693,514 people shows a moderate positive correlation between the proportion of Guamanians/Chamorros and household income with householder between the ages 25 and 44 in the United States with a correlation coefficient (R) of 0.420 and weighted average of $93,569, a difference of 15.0%.
Householder Income Ages 25 - 44 years Correlation Summary
| Measurement | Bangladeshi | Guamanian/Chamorro |
| Minimum | $36,818 | $52,500 |
| Maximum | $114,417 | $250,001 |
| Range | $77,599 | $197,501 |
| Mean | $76,117 | $99,073 |
| Median | $77,308 | $94,237 |
| Interquartile 25% (IQ1) | $66,732 | $81,009 |
| Interquartile 75% (IQ3) | $87,531 | $107,396 |
| Interquartile Range (IQR) | $20,799 | $26,387 |
| Standard Deviation (Sample) | $15,116 | $36,403 |
| Standard Deviation (Population) | $14,978 | $35,864 |
Similar Demographics by Householder Income Ages 25 - 44 years
Demographics Similar to Bangladeshis by Householder Income Ages 25 - 44 years
In terms of householder income ages 25 - 44 years, the demographic groups most similar to Bangladeshis are Immigrants from Dominica ($81,351, a difference of 0.020%), Immigrants from Guatemala ($81,341, a difference of 0.030%), Cuban ($81,483, a difference of 0.15%), Dominican ($81,229, a difference of 0.17%), and Blackfeet ($81,531, a difference of 0.21%).
| Demographics | Rating | Rank | Householder Income Ages 25 - 44 years |
| Comanche | 0.1 /100 | #288 | Tragic $82,152 |
| Shoshone | 0.1 /100 | #289 | Tragic $82,062 |
| Liberians | 0.1 /100 | #290 | Tragic $82,005 |
| Potawatomi | 0.1 /100 | #291 | Tragic $81,774 |
| Yaqui | 0.1 /100 | #292 | Tragic $81,656 |
| Blackfeet | 0.1 /100 | #293 | Tragic $81,531 |
| Cubans | 0.1 /100 | #294 | Tragic $81,483 |
| Bangladeshis | 0.1 /100 | #295 | Tragic $81,363 |
| Immigrants | Dominica | 0.1 /100 | #296 | Tragic $81,351 |
| Immigrants | Guatemala | 0.1 /100 | #297 | Tragic $81,341 |
| Dominicans | 0.1 /100 | #298 | Tragic $81,229 |
| Immigrants | Liberia | 0.1 /100 | #299 | Tragic $80,863 |
| Cherokee | 0.0 /100 | #300 | Tragic $80,843 |
| Immigrants | Micronesia | 0.0 /100 | #301 | Tragic $80,544 |
| Hispanics or Latinos | 0.0 /100 | #302 | Tragic $80,515 |
Demographics Similar to Guamanians/Chamorros by Householder Income Ages 25 - 44 years
In terms of householder income ages 25 - 44 years, the demographic groups most similar to Guamanians/Chamorros are German ($93,531, a difference of 0.040%), Uruguayan ($93,631, a difference of 0.070%), French ($93,665, a difference of 0.10%), Puget Sound Salish ($93,661, a difference of 0.10%), and Immigrants from Eritrea ($93,466, a difference of 0.11%).
| Demographics | Rating | Rank | Householder Income Ages 25 - 44 years |
| Immigrants | Immigrants | 48.0 /100 | #176 | Average $94,423 |
| Belgians | 45.8 /100 | #177 | Average $94,262 |
| Immigrants | South America | 42.8 /100 | #178 | Average $94,042 |
| French Canadians | 38.2 /100 | #179 | Fair $93,694 |
| French | 37.8 /100 | #180 | Fair $93,665 |
| Puget Sound Salish | 37.7 /100 | #181 | Fair $93,661 |
| Uruguayans | 37.3 /100 | #182 | Fair $93,631 |
| Guamanians/Chamorros | 36.5 /100 | #183 | Fair $93,569 |
| Germans | 36.0 /100 | #184 | Fair $93,531 |
| Immigrants | Eritrea | 35.2 /100 | #185 | Fair $93,466 |
| Sierra Leoneans | 34.8 /100 | #186 | Fair $93,435 |
| Spaniards | 34.0 /100 | #187 | Fair $93,366 |
| Immigrants | Sierra Leone | 30.9 /100 | #188 | Fair $93,115 |
| Dutch | 30.5 /100 | #189 | Fair $93,081 |
| Welsh | 30.0 /100 | #190 | Fair $93,039 |