Immigrants from Central America vs Sioux Householder Income Ages 45 - 64 years
COMPARE
Immigrants from Central America
Sioux
Householder Income Ages 45 - 64 years
Householder Income Ages 45 - 64 years Comparison
Immigrants from Central America
Sioux
$85,965
HOUSEHOLDER INCOME AGES 45 - 64 YEARS
0.1/ 100
METRIC RATING
292nd/ 347
METRIC RANK
$81,750
HOUSEHOLDER INCOME AGES 45 - 64 YEARS
0.0/ 100
METRIC RATING
322nd/ 347
METRIC RANK
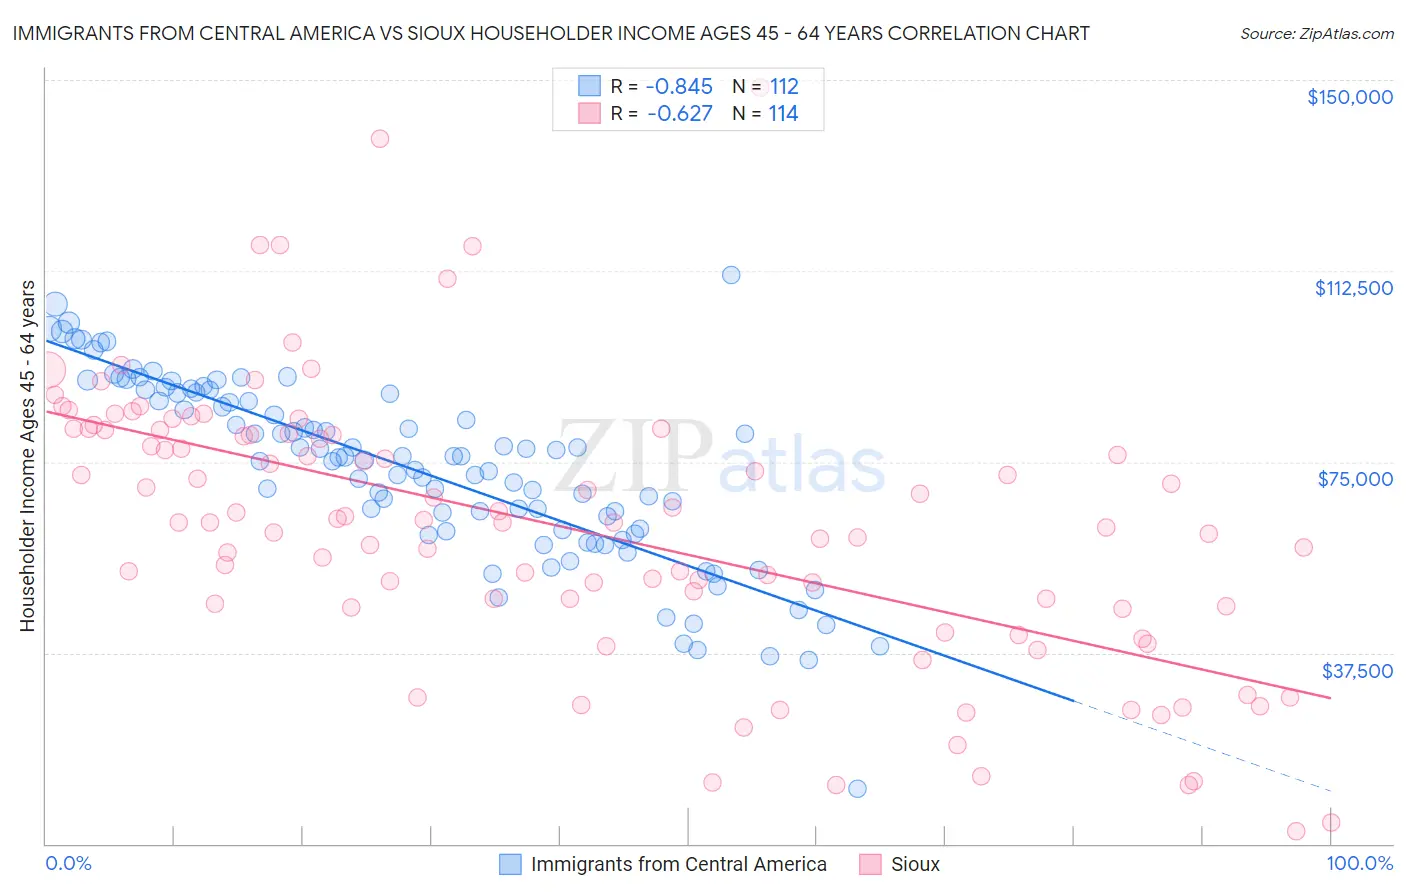
Immigrants from Central America vs Sioux Householder Income Ages 45 - 64 years Correlation Chart
The statistical analysis conducted on geographies consisting of 533,887,943 people shows a very strong negative correlation between the proportion of Immigrants from Central America and household income with householder between the ages 45 and 64 in the United States with a correlation coefficient (R) of -0.845 and weighted average of $85,965. Similarly, the statistical analysis conducted on geographies consisting of 233,839,839 people shows a significant negative correlation between the proportion of Sioux and household income with householder between the ages 45 and 64 in the United States with a correlation coefficient (R) of -0.627 and weighted average of $81,750, a difference of 5.2%.
Householder Income Ages 45 - 64 years Correlation Summary
| Measurement | Immigrants from Central America | Sioux |
| Minimum | $10,788 | $2,499 |
| Maximum | $111,667 | $148,571 |
| Range | $100,879 | $146,072 |
| Mean | $73,521 | $62,223 |
| Median | $75,933 | $63,145 |
| Interquartile 25% (IQ1) | $61,476 | $46,523 |
| Interquartile 75% (IQ3) | $88,461 | $80,556 |
| Interquartile Range (IQR) | $26,985 | $34,033 |
| Standard Deviation (Sample) | $17,981 | $27,229 |
| Standard Deviation (Population) | $17,900 | $27,109 |
Similar Demographics by Householder Income Ages 45 - 64 years
Demographics Similar to Immigrants from Central America by Householder Income Ages 45 - 64 years
In terms of householder income ages 45 - 64 years, the demographic groups most similar to Immigrants from Central America are Hispanic or Latino ($86,006, a difference of 0.050%), Cherokee ($86,125, a difference of 0.19%), Comanche ($85,787, a difference of 0.21%), Cuban ($86,301, a difference of 0.39%), and British West Indian ($85,571, a difference of 0.46%).
| Demographics | Rating | Rank | Householder Income Ages 45 - 64 years |
| Blackfeet | 0.1 /100 | #285 | Tragic $86,595 |
| Immigrants | Guatemala | 0.1 /100 | #286 | Tragic $86,573 |
| Bangladeshis | 0.1 /100 | #287 | Tragic $86,402 |
| Immigrants | St. Vincent and the Grenadines | 0.1 /100 | #288 | Tragic $86,394 |
| Cubans | 0.1 /100 | #289 | Tragic $86,301 |
| Cherokee | 0.1 /100 | #290 | Tragic $86,125 |
| Hispanics or Latinos | 0.1 /100 | #291 | Tragic $86,006 |
| Immigrants | Central America | 0.1 /100 | #292 | Tragic $85,965 |
| Comanche | 0.1 /100 | #293 | Tragic $85,787 |
| British West Indians | 0.1 /100 | #294 | Tragic $85,571 |
| Immigrants | Grenada | 0.1 /100 | #295 | Tragic $85,552 |
| Immigrants | Zaire | 0.1 /100 | #296 | Tragic $85,207 |
| Fijians | 0.1 /100 | #297 | Tragic $85,187 |
| Africans | 0.0 /100 | #298 | Tragic $84,925 |
| Immigrants | Mexico | 0.0 /100 | #299 | Tragic $84,910 |
Demographics Similar to Sioux by Householder Income Ages 45 - 64 years
In terms of householder income ages 45 - 64 years, the demographic groups most similar to Sioux are Bahamian ($81,369, a difference of 0.47%), Yuman ($82,139, a difference of 0.48%), Apache ($82,184, a difference of 0.53%), Chickasaw ($82,193, a difference of 0.54%), and Choctaw ($82,287, a difference of 0.66%).
| Demographics | Rating | Rank | Householder Income Ages 45 - 64 years |
| Paiute | 0.0 /100 | #315 | Tragic $82,629 |
| Immigrants | Caribbean | 0.0 /100 | #316 | Tragic $82,513 |
| Colville | 0.0 /100 | #317 | Tragic $82,474 |
| Choctaw | 0.0 /100 | #318 | Tragic $82,287 |
| Chickasaw | 0.0 /100 | #319 | Tragic $82,193 |
| Apache | 0.0 /100 | #320 | Tragic $82,184 |
| Yuman | 0.0 /100 | #321 | Tragic $82,139 |
| Sioux | 0.0 /100 | #322 | Tragic $81,750 |
| Bahamians | 0.0 /100 | #323 | Tragic $81,369 |
| Yup'ik | 0.0 /100 | #324 | Tragic $81,000 |
| Immigrants | Cuba | 0.0 /100 | #325 | Tragic $80,662 |
| Dominicans | 0.0 /100 | #326 | Tragic $80,623 |
| Seminole | 0.0 /100 | #327 | Tragic $80,077 |
| Natives/Alaskans | 0.0 /100 | #328 | Tragic $79,816 |
| Dutch West Indians | 0.0 /100 | #329 | Tragic $79,171 |