Pima vs Seminole Median Household Income
COMPARE
Pima
Seminole
Median Household Income
Median Household Income Comparison
Pima
Seminole
$63,262
MEDIAN HOUSEHOLD INCOME
0.0/ 100
METRIC RATING
342nd/ 347
METRIC RANK
$69,420
MEDIAN HOUSEHOLD INCOME
0.0/ 100
METRIC RATING
325th/ 347
METRIC RANK
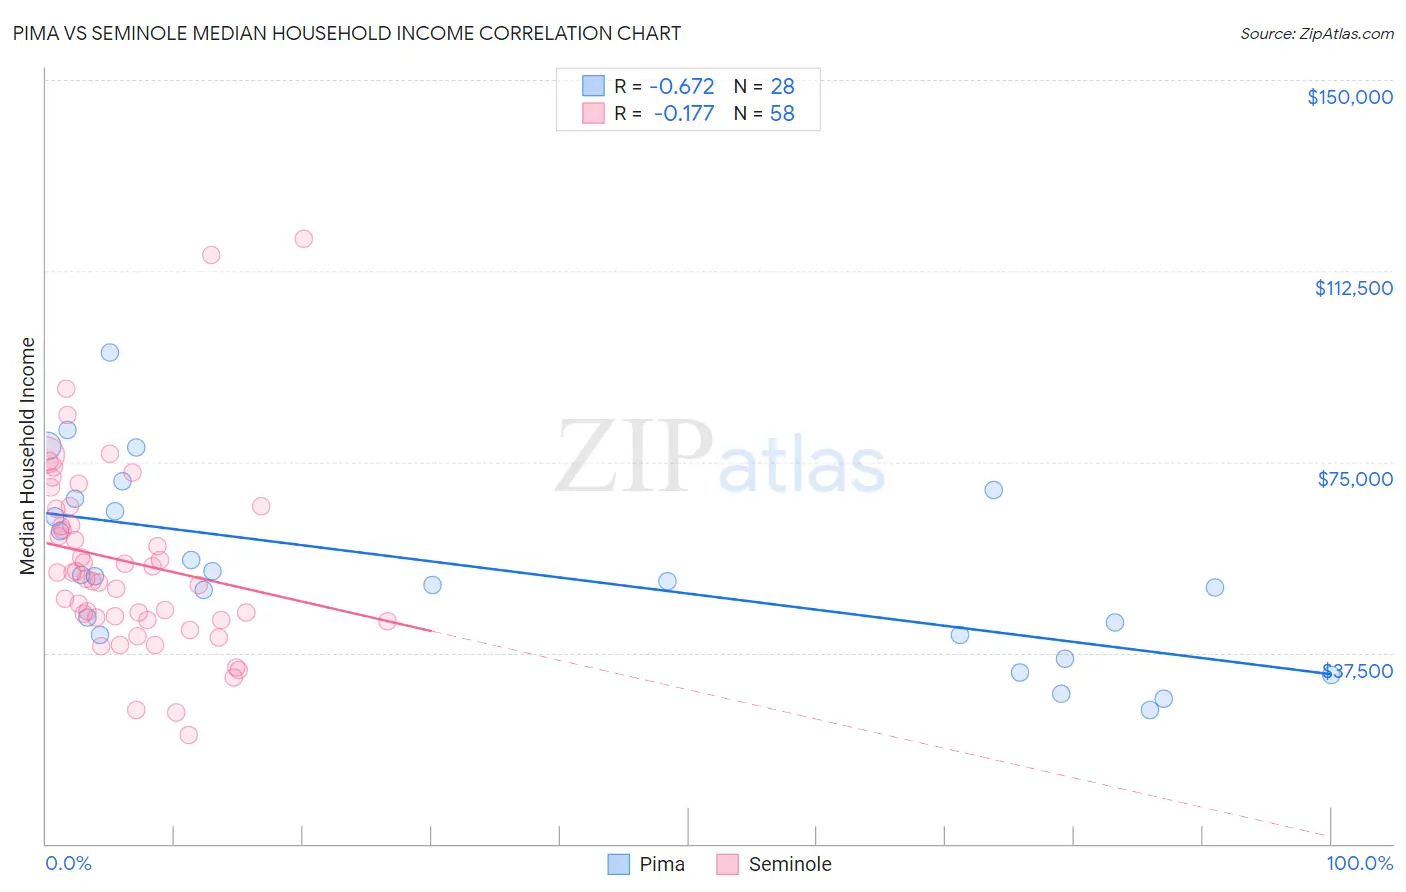
Pima vs Seminole Median Household Income Correlation Chart
The statistical analysis conducted on geographies consisting of 61,537,269 people shows a significant negative correlation between the proportion of Pima and median household income in the United States with a correlation coefficient (R) of -0.672 and weighted average of $63,262. Similarly, the statistical analysis conducted on geographies consisting of 118,297,671 people shows a poor negative correlation between the proportion of Seminole and median household income in the United States with a correlation coefficient (R) of -0.177 and weighted average of $69,420, a difference of 9.7%.
Median Household Income Correlation Summary
| Measurement | Pima | Seminole |
| Minimum | $26,339 | $21,429 |
| Maximum | $96,415 | $118,750 |
| Range | $70,076 | $97,321 |
| Mean | $53,826 | $55,357 |
| Median | $52,032 | $52,689 |
| Interquartile 25% (IQ1) | $40,965 | $44,050 |
| Interquartile 75% (IQ3) | $66,485 | $65,850 |
| Interquartile Range (IQR) | $25,519 | $21,800 |
| Standard Deviation (Sample) | $17,724 | $18,667 |
| Standard Deviation (Population) | $17,405 | $18,505 |
Demographics Similar to Pima and Seminole by Median Household Income
In terms of median household income, the demographic groups most similar to Pima are Crow ($63,681, a difference of 0.66%), Houma ($62,575, a difference of 1.1%), Pueblo ($64,692, a difference of 2.3%), Hopi ($65,043, a difference of 2.8%), and Immigrants from Yemen ($65,194, a difference of 3.0%). Similarly, the demographic groups most similar to Seminole are Yup'ik ($69,695, a difference of 0.40%), Bahamian ($69,726, a difference of 0.44%), Yuman ($68,743, a difference of 0.98%), Immigrants from Cuba ($68,461, a difference of 1.4%), and Menominee ($68,423, a difference of 1.5%).
| Demographics | Rating | Rank | Median Household Income |
| Bahamians | 0.0 /100 | #323 | Tragic $69,726 |
| Yup'ik | 0.0 /100 | #324 | Tragic $69,695 |
| Seminole | 0.0 /100 | #325 | Tragic $69,420 |
| Yuman | 0.0 /100 | #326 | Tragic $68,743 |
| Immigrants | Cuba | 0.0 /100 | #327 | Tragic $68,461 |
| Menominee | 0.0 /100 | #328 | Tragic $68,423 |
| Dutch West Indians | 0.0 /100 | #329 | Tragic $68,412 |
| Arapaho | 0.0 /100 | #330 | Tragic $67,965 |
| Natives/Alaskans | 0.0 /100 | #331 | Tragic $67,879 |
| Sioux | 0.0 /100 | #332 | Tragic $67,792 |
| Creek | 0.0 /100 | #333 | Tragic $67,715 |
| Blacks/African Americans | 0.0 /100 | #334 | Tragic $67,573 |
| Cheyenne | 0.0 /100 | #335 | Tragic $66,974 |
| Immigrants | Congo | 0.0 /100 | #336 | Tragic $66,768 |
| Kiowa | 0.0 /100 | #337 | Tragic $65,914 |
| Immigrants | Yemen | 0.0 /100 | #338 | Tragic $65,194 |
| Hopi | 0.0 /100 | #339 | Tragic $65,043 |
| Pueblo | 0.0 /100 | #340 | Tragic $64,692 |
| Crow | 0.0 /100 | #341 | Tragic $63,681 |
| Pima | 0.0 /100 | #342 | Tragic $63,262 |
| Houma | 0.0 /100 | #343 | Tragic $62,575 |