Pima vs Bulgarian Median Household Income
COMPARE
Pima
Bulgarian
Median Household Income
Median Household Income Comparison
Pima
Bulgarians
$63,262
MEDIAN HOUSEHOLD INCOME
0.0/ 100
METRIC RATING
342nd/ 347
METRIC RANK
$96,290
MEDIAN HOUSEHOLD INCOME
99.9/ 100
METRIC RATING
50th/ 347
METRIC RANK
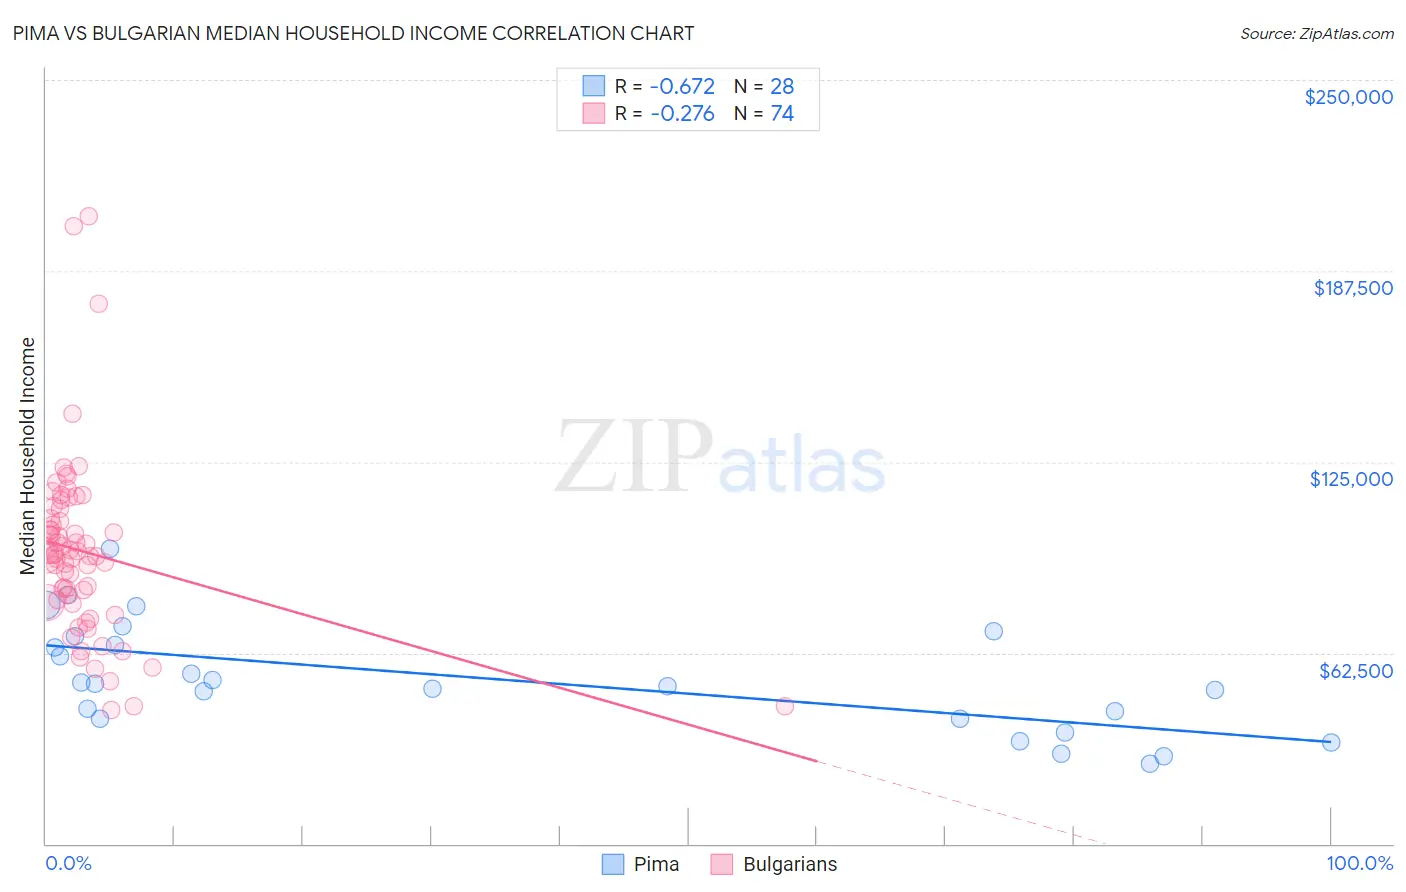
Pima vs Bulgarian Median Household Income Correlation Chart
The statistical analysis conducted on geographies consisting of 61,537,269 people shows a significant negative correlation between the proportion of Pima and median household income in the United States with a correlation coefficient (R) of -0.672 and weighted average of $63,262. Similarly, the statistical analysis conducted on geographies consisting of 205,543,372 people shows a weak negative correlation between the proportion of Bulgarians and median household income in the United States with a correlation coefficient (R) of -0.276 and weighted average of $96,290, a difference of 52.2%.
Median Household Income Correlation Summary
| Measurement | Pima | Bulgarian |
| Minimum | $26,339 | $43,716 |
| Maximum | $96,415 | $205,412 |
| Range | $70,076 | $161,696 |
| Mean | $53,826 | $95,604 |
| Median | $52,032 | $94,643 |
| Interquartile 25% (IQ1) | $40,965 | $79,613 |
| Interquartile 75% (IQ3) | $66,485 | $106,436 |
| Interquartile Range (IQR) | $25,519 | $26,823 |
| Standard Deviation (Sample) | $17,724 | $28,917 |
| Standard Deviation (Population) | $17,405 | $28,721 |
Similar Demographics by Median Household Income
Demographics Similar to Pima by Median Household Income
In terms of median household income, the demographic groups most similar to Pima are Crow ($63,681, a difference of 0.66%), Houma ($62,575, a difference of 1.1%), Pueblo ($64,692, a difference of 2.3%), Tohono O'odham ($61,663, a difference of 2.6%), and Hopi ($65,043, a difference of 2.8%).
| Demographics | Rating | Rank | Median Household Income |
| Creek | 0.0 /100 | #333 | Tragic $67,715 |
| Blacks/African Americans | 0.0 /100 | #334 | Tragic $67,573 |
| Cheyenne | 0.0 /100 | #335 | Tragic $66,974 |
| Immigrants | Congo | 0.0 /100 | #336 | Tragic $66,768 |
| Kiowa | 0.0 /100 | #337 | Tragic $65,914 |
| Immigrants | Yemen | 0.0 /100 | #338 | Tragic $65,194 |
| Hopi | 0.0 /100 | #339 | Tragic $65,043 |
| Pueblo | 0.0 /100 | #340 | Tragic $64,692 |
| Crow | 0.0 /100 | #341 | Tragic $63,681 |
| Pima | 0.0 /100 | #342 | Tragic $63,262 |
| Houma | 0.0 /100 | #343 | Tragic $62,575 |
| Tohono O'odham | 0.0 /100 | #344 | Tragic $61,663 |
| Puerto Ricans | 0.0 /100 | #345 | Tragic $59,197 |
| Navajo | 0.0 /100 | #346 | Tragic $59,159 |
| Lumbee | 0.0 /100 | #347 | Tragic $54,644 |
Demographics Similar to Bulgarians by Median Household Income
In terms of median household income, the demographic groups most similar to Bulgarians are Immigrants from Malaysia ($96,292, a difference of 0.0%), Cambodian ($96,324, a difference of 0.040%), Immigrants from Russia ($96,378, a difference of 0.090%), Australian ($96,490, a difference of 0.21%), and Israeli ($96,552, a difference of 0.27%).
| Demographics | Rating | Rank | Median Household Income |
| Immigrants | France | 99.9 /100 | #43 | Exceptional $96,743 |
| Immigrants | Greece | 99.9 /100 | #44 | Exceptional $96,675 |
| Israelis | 99.9 /100 | #45 | Exceptional $96,552 |
| Australians | 99.9 /100 | #46 | Exceptional $96,490 |
| Immigrants | Russia | 99.9 /100 | #47 | Exceptional $96,378 |
| Cambodians | 99.9 /100 | #48 | Exceptional $96,324 |
| Immigrants | Malaysia | 99.9 /100 | #49 | Exceptional $96,292 |
| Bulgarians | 99.9 /100 | #50 | Exceptional $96,290 |
| Estonians | 99.9 /100 | #51 | Exceptional $95,930 |
| Immigrants | South Africa | 99.9 /100 | #52 | Exceptional $95,800 |
| Paraguayans | 99.9 /100 | #53 | Exceptional $95,737 |
| Egyptians | 99.9 /100 | #54 | Exceptional $95,673 |
| Immigrants | Czechoslovakia | 99.9 /100 | #55 | Exceptional $95,319 |
| Immigrants | Austria | 99.9 /100 | #56 | Exceptional $95,277 |
| New Zealanders | 99.8 /100 | #57 | Exceptional $95,146 |